Is Asia File still a value trap as of Nov 2023?
Value Investing Case Study 02-4. Asia File: Navigating disruption and unlocking value. This is an updated fundamental analysis and valuation of Asia File based on the financial results till FYE Mac 2023.
I first covered Asia File Corporation Bhd (Asia File or the Group) in Jul 2020. At that juncture, it was trading at RM 1.85 per share compared to its NTA of RM 3.06 per share. I had concluded that it was not a value trap.
This is my latest update of Asia File based on the financials till FYE March 2023. In this article, I pulled together all the analyses from my previous articles. If you had try to access them, you would be redirected here.
The market price currently is RM 1.95 per share (16 Oct 2023). My updated analysis showed that it is still not a value trap.
To be transparent I invested in Asia File years ago and I am still holding onto the stock. My average purchase price was RM 3.00 per share. But over the years I have recovered about half of that from dividends. My net exposure today is still below the current market price.
Should you go and buy Asia File? See my Disclaimer.
Contents
- Executive Summary
- Investment thesis
- Business background
- Operating performance
- Financial position
- Risks
- Valuation
- Conclusion
- Appendix 1. Expansion into Europe
- Appendix 2. Digital disruption
|
Executive Summary
- As a stationery company, Asia File faces the threat of digital disruption. The Group has recognized this by not expanding into this sector. Instead it diversified into food wares and consumer wares that in 2023 accounted for 16% of the Group revenue.
- Both the stationery and food/consumer wares businesses are profitable and generating good returns. But the overall ROE is low as about 2/3 of its total assets are non-operating assets.
- The Group is financial sound. This should give it breathing space to seek other new ventures as well grow the food wares and consumer wares business.
- The current market price is well below its Asset Value and Earnings Value. I do not consider Asia File a value trap.
Investment thesis
The Group had not pursued any expansion into the stationery sector over the past decade. Nevertheless its filing segment is a good cash cow.
To address the digital disruption, the Group diversified into food wares and consumer wares in 2017. The Group has plans to grow this business as well a seek other new ventures.
The challenge is that about 2/3 of its capital is tied up in non-operating assets that generated low returns. This has resulted in overall low returns for the Group. It would have to depend on new ventures to rectify this. The Group is financially strong and this will give it time to deliver these.
My valuation showed that it is not a value trap. There is sufficient margins of safety to invest at the current market price. But you need to have a long-term view.
|
|
Business background
Asia File is a global stationery company. Headquartered in Penang, Malaysia, the Group’s facilities consist of:
- 7 production and warehousing sites in Malaysia.
- 2 manufacturing plants and one paper mill in the United Kingdom.
- 2 manufacturing facilities in Germany.
In FYE 2023, Malaysia accounted for about ¼ of the Group revenue. As can be seen from Chart 1, the bulk of its revenue comes from Europe. Refer to Appendix 1 for a history of the Group’s expansion into Europe.
 |
| Chart 1: Revenue trend |
The Group’s core product category covers a wide range of filing products and filing accessories made from quality paperboard, plastics, and metals.
Asia File remains the No. 1 file manufacturer in Malaysia with its ABBA brand. The Group has dominant standing in the United Kingdom and part of Europe. Its filing products have also been exported across various continents.
As part of the Group’s diversification plan initiated five years ago, it has ventured into recyclable food wares and consumer wares. In FYE 2023, this accounted for about 16% of the Group’s revenue.
This food wares and consumer wares is still a Malaysia-centric business as in its 2022 Annual Report, the company stated that:
“In the near future, the Group plans to expand this business segment internationally in particularly Europe…”
Operating performance
I looked at 3 metrics to get an overview of the overall performance – revenue, PAT, and gross profitability (gross profits / total assets). Refer to Chart 2.
Revenue and PAT peaked in 2016 with declining trends since then. The main reason was the declining stationery business.
In 2012/13, the stationery business generated an average of about RM 300 million in revenue per year. This had reduced to an average of RM 270 million per year in 2022/23.
The Group revenue trend would be worse if not for the food wares and consumer wares operations. These averaged RM 50 million in revenue per year in 2022/23. It was not in existence in 2012/13.
While the revenue seemed to have turned around to stabilize in 2022/23, PAT and gross profitability continued to decline. There were several reasons for the declining PAT:
- Firstly, the ringgit profit declined in tandem with the decline in revenue.
- There was also a decline in the net margin as can be seen from Chart 3. I defined the net margin = gross profit margin – SGA or Selling, General and Administration margin. While the gross profit margin was trending down, the SGA margin was increasing (except for the past 2 years).
- The portion of non-operating assets (eg cash, investments in associates) increased over the years. In 2012 it was RM 177 million. By 2023, it was RM 496 million. The profits from the non-operating assets were low compared to those from the operating assets.
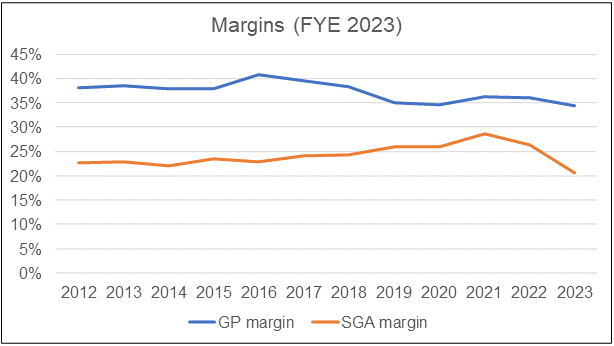 |
| Chart 3: Gross profit margin and SGA margin trends Notes to Chart 3: a) SGA = Selling, General and Administration expenses. b) SGA margin = SGA/Revenue. |
Margins
You may think that the declining gross profit margin is a reflection of the challenges in the stationery sector. But when you compare Asia File gross profit margin trends with those of its peers, the picture is not so clear cut.
- There are 3 other Bursa stationery companies – CWG, Pelikan and UPA. You can see from Chart 4 that the gross profit margins for Pelikan and UPA seems to be holding whereas Asia File and UPA margins had declined since 2016.
- The Japanense and Chinese listed stationery companies show a similar situation. Some companies managed to maintain their gross profit margins while others declined. Refer to Chart 6.
I suspect that the differences are due to the different stationery products of these companies.
 |
| Chart 4: Peer gross margin trends |
As for Asia File’s SGA margin, while it increased, this was more due to a reduction in the revenue. The ringgit amount of SGA expenses was reasonably stable over the past 12 years. Refer to Chart 5.
 |
| Chart 5: P&L components |
Large non-operating assets
I wanted to get a sense of how well the total capital of the Group has been deployed. As such I divided the Group into 3 components – filing, food and consumer wares, and non-operating assets.
The non-operating assets include investment properties, investments in associates and securities, and cash.
Table 1 shows the 2023 revenue and profits in this context. I assessed the return as segment profits / TCE or total capital employed)
You can see that the non-operating assets, which accounted for 66 % of the total capital, had negative returns.
The positive sign is that the return from the new and growing food and consumer wares business is similar to that for the filing business.
Given the increasing non-operating assets, declining gross profitability declined.
Digital disruption
The stationery business is being disrupted by digital technology. The Group recognizes this as in its 2023 Annual Report, it stated:
“The advent of digital technologies…has transformed the way information is stored…will reduce the reliance on physical files…the demand for traditional physical files may decline over time.”
For a more detailed discussion on this, refer to Appendix 2.
While there is the threat of digital disruption, there is no immediate danger. This is because the revenues and gross profit margins of the listed stationery products companies in Japan and China are still holding. Refer to Chart 6.
Competitors
To get a sense of how well Asia File was doing relative to its peers, I compared its ROE trends with those of 3 other Bursa companies in the stationery sector. These are CWG, Pelikan and UPA.
Refer to Chart 7 where Asia File is denoted by the light blue line. You can see that most of the time, Asia File was the best performer.
What are the key takeaways from the above?
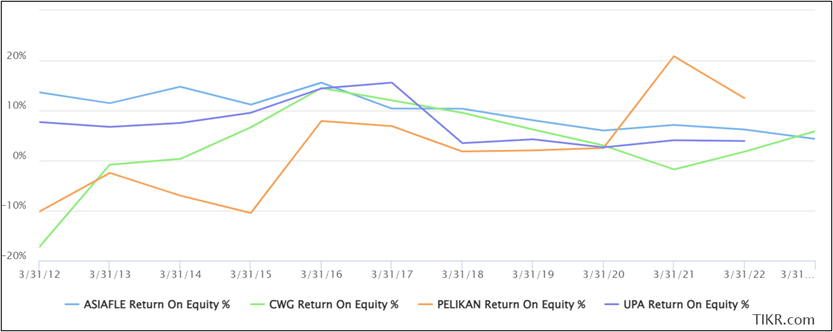 |
| Chart 7: Peer ROE trends |
The global stationery market is still projected to grow at about 4% over the next decade (refer to Appendix 2). From a conservative perspective, it is better to assume that filing segment would not see significant revenue growth.
Looking at Chart 1 and Table 1, the food and consumer wares segment can offset the filing business revenue. And they both have similar returns. What is not clear yet is whether the food and consumer total addressable market is as large as Asia File's stationery market niche.
Financial position
I would rate Asia File as financially strong based on the following:
- As of the end of June 2023, it had cash and securities of RM 303 million. This is about 37 % of its total assets.
- As of the end of June 2023, it had zero bank loans. The only debt component came from its leases which amounted to less than RM 3 million.
- It had been able to generate positive cash flow from operations every year over the past 12 years.
- Over the past 12 years, it generated an average of RM 47 million per year in cash flow from operations compared to an average PAT of RM 50 million per year. This is a good cash conversion record.
- It has a good capital allocation track record as shown in Table 2. About 45% of the cash flow from operations was returned to shareholders in the form of dividends and buybacks. A large part of the balance was reinvested into the operations.
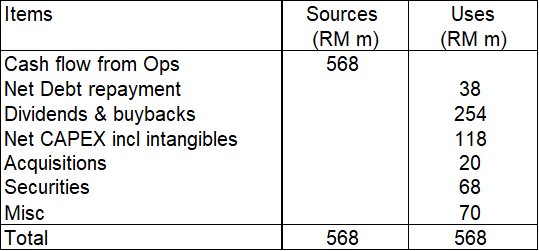 |
| Table 2: Sources and Uses of Funds 2012 to 2023 |
Table 2 shows clearly that the filing business is a cash cow for the company. This is reinforced by the low Reinvestment rate.
I defined Reinvestment rate = Reinvestment / EBIT (I-T).
Reinvestment = CAPEX + Acquisitions – Depreciation & Amortization + Net Increase in Working Capital.
I estimate that over the past 12 years, Asia File incurred an average Reinvestment of RM 4.9 million per year. Its average EBIT(1-t) over the same period came to RM 48.1 million per year. The Reinvestment rate = 4.9 / 48.1 = 10%.
Shareholders’ value
I used 2 metrics to look at shareholders' value creation:
- Comparing returns with the cost of funds.
- Q Rating.
Over the past 12 years, it achieved an average ROE of 9.6 % compared to its cost of equity of 7.9 %. This meant that it managed to create shareholders’ value.
In 2023 Asia File has an overall Q Rating score of 0.53 placing it above the 75% ranking of the panel companies. Refer to Chart 8.
The rating reflects the strong profitability, financial position, and risk. However, the rating highlights its poor growth. I will interpret the rating to mean that the Group would be able to sustain its earnings but do not expect to see significant earnings growth.
You can see that the 2023 Q Rating is very much in line with that for 2020.
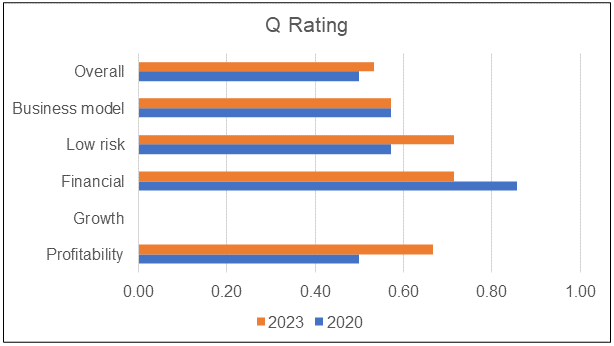 |
| Chart 8: Comparative Q Rating |
The key takeaway for this section is that this is a financially sound Group. Its main challenge is growth. Unfortunately, this has to come from new ventures.
Risks
When you look at risk, you have to consider not only business risk but also your own risk as an investor.
Your risk covers the risk of the Group being privatized while the major business risk relates to the Group’s business direction.
Privatization
In Asia File's case, the major shareholder collectively controls about 46 % of the company. Any privatization plan to acquire the remaining 54 % at the current market price of RM 1.95 per share would require about RM 205 million.
The company has cash and securities of about RM 303 million (as of June 2023). So, it is possible to take it private via a capital reduction route.
While I cannot read the minds of the shareholders, note that Amanah Raya is an institutional investor of Asia File with about 19 % as of the end of June 2023.
I would think that any privatization offer by the controlling shareholders would need to be at an attractive price for Amanah Raya to vote for it. I doubt the current market price is attractive.
This would minimize privatization risk. Besides if there was any privatization plan, it would be been undertaken a few years ago when the price was much lower at about RM 1.42 per share.
Strategic Direction
Over the past 12 years, Asia File had to meet the digital disruption challenge.
The performance of Asia File and a number of its Bursa-listed peers over the past 12 years reflects the challenging industry.
This is not a high-growth business.
When Asia File's share price was at its peak in 2016 the Group had a ROE of 15%. In 2023 this had come down to 4 % which is below its cost of funds.
One of the key requirements for shareholders’ value creation is for the ROE to be greater than its cost of funds.
To be above its cost of funds, given its RM 751 million total equity and debt, and a WACC of 7.9%, the threshold is RM 59 million PAT annually.
With substantial non-operating assets, the Group would not be able to achieve this with the current filing business. It has to deploy its cash into higher return ventures. This is where the biggest risk will come from.
About 2 decades ago, the Group set on a path to be an international integrated filing company. I believe that the Group is now at a similar crossroads that will shape its future.
I think that in the 2023 Annual Report, the Group has given a glimpse of its strategic direction:
- Enhance existing operations.
- Expand its food ware and consumer ware business.
- Seek other new ventures.
In its first diversification, Asia File built on its manufacturing expertise to venture into food wares. It took the Group about 5 years to grow this to be an RM 50 million business.
This is about 1/5 the size of the filing business. At this stage, it is not clear whether the food and consumer wares business could be as big as the filing business
I have covered several US packaging companies (including those in the F&B) sector for Seeking Alpha. The global packaging business is not a high-growth sector with a projected CAGR of about 4%.
Given this, the Group needs to think of another investment that within a decade could be as large as the current filing business.
I am not sure whether the Group has thought in such quantum leap terms. If not, there will be limited growth.
But a quantum leap will have to be from new ventures where Asia File is unlikely to have the expertise. It has no track record of such ventures.
It is between the devil and the deep blue sea!
Valuation
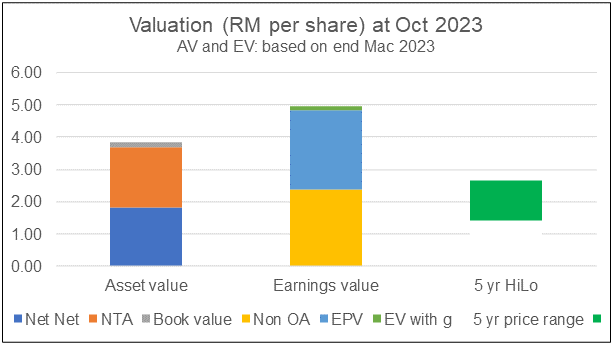
My value of Asia File is summarized in Chart 9.
- I estimated its Asset Value as RM 3.84 per share broken down into Graham Net Net, NTA, and Book value.
- I estimated its Earnings Value as RM 4.97 per share. You can see that the non-operating assets accounted for about half of this value. A significant part of the balance came from its Earnings Power Value.
 |
| Chart 9: Valuation |
At RM 1.95 per share, Asia File is trading significantly below the Asset Value and Earnings Value. It is even trading below its non-operating assets of RM 2.39 per share.
Over the past 5 years and even currently, the market price of Asia File share has been below the Earning Power Value.
Looking at the above, I would conclude that there is a sufficient margin of safety. It is not a value trap as:
- The existing operations are still viable and generating good returns.
- The investment in associates is equal to RM 1.12 per share.
Even if you write off all its investments in associates, there is still more than a 30% margin of safety from the resulting Asset Value and Earnings Value.
Valuation model
My Earnings Value of the company was derived based on the average values from 2 valuation approaches:
- Free Cash Flow to the Firm model as per Damodaran.
- Residual Income model as per Penman.
For both models, I used the past 12 years’ time-weighted average value to represent the normalized value.
The cost of capital used in the model was based on the Capital Asset Pricing Model. I followed Damodaran’s approach to determine the Beta and the risk premiums.
These resulted in a both 7.9 % cost of equity and WACC. Note that the values for both are about the same due to the low debt situation.
Valuation risks and limitations
There are 3 critical assumptions in my valuation
- Cost of capital.
- Continuation of historical performance.
- Value of the associate, Muda Holdings.
The cost of capital was derived based on the risk-free rate and equity risk premium as of 2022. We currently have the Ukraine invasion and the Israel-Gaza conflict. The parameters do not reflect the higher-risk situation.
As such you should see the Earnings Value as an optimistic one. The only mitigating point is that the margin of safety is sufficiently large.
My valuation model assumes that the past 12 years' performance is a good reflection of the future. In a company undergoing a turnaround or venturing into new areas, this is a very conservative picture.
If you think that the future would be better than the past, then my Earnings Values are conservative. Of course, if you think that the future would be worse, my Earnings Values are optimistic.
Finally, in my valuation, I considered the book value of the associates. This is about RM 218 million. However, an EPV of Muda Holdings (refer to the Case Notes) showed that the investment is only worth RM 101 million. This is thus an over-valuation of RM 117 million equivalent to RM 0.60 per share.
|
Conclusion
Asia File is a company facing digital disruption for its filing business. However, the potential disruption by digital technology is still unclear. This gives the existing business some runway to continue to be profitable.
The Group has addressed this threat by not expanding the stationery business. Instead, it ventured into food and consumer wares that in 2023 accounted for 16% of the Group revenue.
I would rate Asia File as sound due to the following:
- Over the past 12 years, it has been able to create shareholders’ value.
- In 2023 it generated reasonable returns from the filing, food wares and consumer wares businesses.
- The Group is financially sound. The filing business is a good cash cow.
The market price did not reflect its Asset value let alone the Earnings value.
A value trap is a stock that while appearing to be a bargain turns out to be a dud. This is because the company has insurmountable problems that affect its profitability.
Asia File value from just cash and investment in associates comes to RM 2.39 per share. From a liquidation perspective, all shareholders will be able to get more than the current share price.
Management has shown that they are prudent in spending money and I am confident that they are cost-conscious. There is ample margin of safety provided you have the holding power.
There is thus downside protection. Asia File is not a value trap.
But with 2/3 of its total assets as non-operating, is there a danger that Asia File is a cash holding value trap? Refer to my case study of Eksons. I do not consider Asia File in this value trap category as:
- It still has a strong operating business.
- About half of the non-operating assets are actually investments in Muda Holdings that has business dealings with Asia File.
Management has mentioned not paying out so much dividends to have a reserve for diversification. However, there is a possibility that the operations may throw up more cash than needed for this. Should this happen, there could be more dividends in the future than what was paid in the last few years.
If you were to invest in Asia File, it must be because you had a long-term horizon. You were betting that either:
- The market will eventually re-rate it based on its existing earning power.
- Better still the Group finds an opportunity to redeploy its cash and the market re-rate on this basis.
For any re-rating, it has to improve its ROE. This will not come from the existing business. I would go so far as to say that if it wants to be re-rated to match the 5-year high price, the ROE should go back to the 15 % level.
Appendix 1. Expansion into Europe
The Group ventured into Europe in the late 90s and by 2004, Europe was the top revenue contributor. But the big growth came from a series of acquisitions.
- 2008 – The group acquired 2 German dividers manufacturers which resulted in increased sales in 2009 from Germany, Norway, and Switzerland.
- 2012 – The Group acquired a paper mill and a filing company in the UK giving the Group strategic control from supply to distribution.
While the Group spent about RM 100 million for these acquisitions (including RM 30 million in goodwill), it more than recovered the investments—a value-added M&A exercise.
Although the Malaysian business did not grow, its 20 % stake in Muda Holdings has added value as its initial investment of RM 45 million in 2008 is recognized as RM 218 million in 2023 due to the post-acquisition reserves.
Appendix 2. Digital disruption
The common understanding is that the stationery industry is ripe for disruption by digital technology. But when you look at secular changes in the industry, you have to differentiate between product disruption and supply chain disruption.
An example of the former is email disrupting the traditional paper-based mail. An example of the latter is how Amazon has disrupted the brick-and-mortar bookstore.
The future of the Group comes down to how it has responded to such secular changes. When I looked at the strategic direction of the Group through its Annual Reports, several things stood out.
1. About 2 decades ago, Asia File started to establish itself as an integrated international filing Group. This led the Group to expand its facilities in Malaysia as well as to acquire several companies in the UK and Germany that gave it access to new markets.
2. The Group direction took a new tone when in 2013, it started to mention the consolidation taking place in the industry, both from the competitor as well as the customer perspectives. This message about consolidation was repeated in several subsequent Annual Reports.
3. Then in 2017, the impact of digital technology on the industry was first mentioned. The Group also announced its venture into the food ware business.
4. In 2023, it mentioned that the usage and consumption of files have been impacted by digital transformation which makes E-filing an alternative to traditional physical filing of documents. However, E-filing would not completely replace physical filing and hence the existing players in the industry would be well-buffered from any potential new competitors given the nature of the industry.
We should differentiate between the impact of consolidation (mainly a supply chain impact) and the impact of digital technology (a product impact).
The former will intensify competition and as stated in the 2019 Annual Report will “exert pricing pressure and impact margins.”
- It is about existing industry players acquiring/merging with other industry players. The impact is bigger and stronger groups vying for the same market.
- It is also about customers merging and giving them stronger bargaining power.
However, the impact of digitalization is generally about the entry of non-traditional players into the stationery market. A good example of this is email replacing the historical pen and paper mail.
It is companies like Google and Microsoft entering the “office communication” market. In contrast with the consolidation phenomenon, the impact of digital technology is the disappearance of the market for traditional products.
It is also highly possible that the impact of digital technology may have been the catalyst for the consolidation taking place in the industry.
Asia File faces both phenomena. How has Asia File met the challenges of consolidation?
It is with new products, both production and product innovation and cost control measures. They have also talked about reshaping the business models, new markets, and deepening customer engagements.
What about digital technology?
Stationery products cover a wide range of materials such as paper, writing instruments, drawing devices, filing and storage products, and greeting cards.
Asia File, with its focus on filing products, operates in a niche segment.
With such a wide range of products, it is not clear nor pre-ordained that the whole industry’s products would be disrupted by digital technology. The stationery industry is not like the taxi industry and with so little product segmentation, the taxi industry as a whole is being disrupted by the likes of Uber and/or Grab.
Based on several excerpts of global market reports as per below, the stationery industry has still not gone the way of the newspaper industry. Most researchers still forecast growth.
- Research and Market projected at a CAGR of 4.6% over the analysis period 2022-2030.
- Fact.MR sees worldwide demand for stationery products to increase by 4.2 % CAGR from 2023 to 2033.
- Grand View Research valued the global stationery market at USD 128.5 billion by 2025 and is expected to grow at a compound annual growth rate (CAGR) of 5.1% during the forecast period (2019 to 2025).
To come back to what Asia File has done to address the impact of digital technology.
- It ventured into the food ware business in 2017. By 2023, this accounted for 16 % of the Group revenue and segment profits.
- It has re-strategized marketing by embracing digital technology and tapping into the vast potential of e-commerce.
Conclusion 1 – do not expect any quantum leap in growth from the current stationery business. I suspect that given the consolidation and digital threat, Asia File is not likely to undertake any other M&A exercise to either expand beyond filing products or to buy into new markets. Any growth for this traditional stationery segment will be organic.
Conclusion 2 – it looks like there may be further diversification based on tapping into its existing food ware and consumer ware businesses. The Group has also stated in its 2023 Annual Report that:
“To ensure sustainable growth, the Group will be on continuous lookout for new ventures whether within or outside its core business.”
End
- - - - - - - - - - - - - - - - - - - - - - - - - - - - - - - - -
How to be an Authoritative Source, Share This Post
|
Disclaimer & Disclosure
I am not an investment adviser, security analyst, or stockbroker. The contents are meant for educational purposes and should not be taken as any recommendation to purchase or dispose of shares in the featured companies. Investments or strategies mentioned on this website may not be suitable for you and you should have your own independent decision regarding them.
The opinions expressed here are based on information I consider reliable but I do not warrant its completeness or accuracy and should not be relied on as such.
I may have equity interests in some of the companies featured.
This blog is reader-supported. When you buy through links in the post, the blog will earn a small commission. The payment comes from the retailer and not from you.


Comments
Post a Comment