Which are the better stocks in Bursa Malaysia furniture sector?
Case Notes 17. This article identified the better furniture companies under Bursa Malaysia. It also compiled the base rates for the furniture sector. Revision date: 14 May 2023
In Sept of 2021, several Malaysian newspapers published reports about the bright prospects of the Malaysian furniture industry. The reports were based on an analysis by Public Investment Bank.
“…positive on the furniture sector’s long-term outlook amid trade diversion due to the US-China trade war…Prior to the Covid-19 pandemic, total Malaysia furniture exports have been growing at a CAGR of 7.6% between 2014-2019 to RM11.9 billion, in tandem with the growth in the global furniture market.” The Edge
“Despite near-term headwinds… we are expecting demand growth for Malaysian furniture to resume once global economy recovers and reverts to normalcy in 2021” The Star
“…has initiated coverage on the sector with an "Overweight" recommendation.” New Straits Times
With such publicity about the furniture sector, you may be forgiven for thinking that any furniture company stocks in the sector is an easy win. But is this the case?
The original article was published in Dec 2021. The video summarizes the changes in the furniture company stocks over the past 2 years.
I am a sceptic when it comes to predicting the future based on socio-political scenarios. Rather I am a strong believer in base rates and with this in mind, I wanted to see how furniture company stocks under Bursa Malaysia performed over the past decade.
The results of the study showed that the sector performance peaked in 2015/16 and it may be tough to get back to the peak. But there are a couple of companies that bucked the trend.
Should you go and buy them? Well, read my Disclaimer.
Contents
- Summary
- Malaysian furniture sector background
- Base rates for the furniture sector
- Screening for the better stocks
- Methodology
- Appendix 1
This blog is reader-supported. When you buy through links in the post, the blog will earn a small commission. The payment comes from the retailer and not from you. Learn more. |
Summary
- There are more than 2 dozen Bursa Malaysia listed companies in the furniture industry. They accounted for about 29 % of the total Malaysian furniture production.
- The furniture company stocks in the sector are relatively small compared to the component companies of the KLCI. About half of the furniture companies had Total Equity (SHF + MI) of less than RM 200 million each. Contrast this with the KLCI component companies where the smallest component company had a total equity of about RM 550 million.
 |
| Chart 1: Furniture Sector ROE |
- The ROE of the sector showed a “humped” pattern with the ROE experiencing a jump in 2014/15. This was mainly due to a 30% increase in the RM to USD exchange rate. Despite this, from 2010 to 2020, the industry average ROE declined at a compounded 5.5 % per annum.
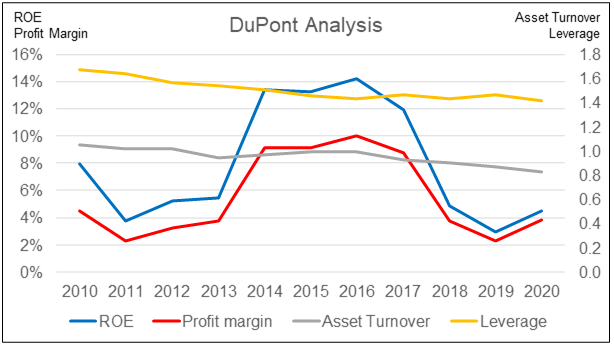
- A DuPont analysis of the ROE trend showed that all the DuPont components contributed to the declining ROE.
 |
| Chart 2: Furniture Sector DuPont Analysis |
The COVID-19 pandemic affected most of the economies around the world in 2020 and 2021. As such, you may think that the results of the furniture companies under Bursa Malaysia would be disappointing, but you are in for a surprise.
- There was no significant revenue decline in 2021 and 2020 compared to 2019. There was even growth in 2021.
- The industry showed a similar pattern in terms of profits. It seemed resilient to the impact of COVID-19.
What does this mean if you are an investor in the stock market?
- The “hump” is from the confluence of demand and forex factors. It would be very challenging for the industry to regain the past decade’s peak performance.
- Look for furniture company stocks whose performance did not follow the “humped” pattern. In other words, look for companies whose performance continued to improve after the 2014/2015 spike.
- To identify potential investments among the furniture companies, I used ROE, Beneish M-Score, Piotroski F-Score and Altzman Z-Score as screens. I identified the following 3 companies - LEESK, LIIHEN and YOCB - for further analysis.
|
Malaysian furniture sector background
The Malaysian furniture sector can be categorized into four main types based on the material used - wooden, panel-based, soft/leather, and metal. However, wooden furniture accounted for the largest proportion of furniture produced.
According to the Malaysian Investment Development Authority, Malaysia is the leading exporter of wooden furniture globally. Under the National Timber Industry Policy, the furniture industry is targeted to contribute RM12 billion in exports by 2020.
Malaysia exported about 80% of its furniture production and is ranked among the top 10 largest exporters of furniture in the world.
One key event that has helped to grow the sector is the Malaysian International Furniture Fair. First launched in 1995, this is an annual furniture fair that attracts local and international furniture exhibitors and buyers.
“Despite numerous economic downturns, the industry is still supported by a strong global demand. While lower priced Chinese and Vietnamese furniture pose strong competition, Malaysian furniture continues to set itself apart with original design that places importance on aesthetics as well as its good work ethics.” Malaysia International Furniture Fair
The following extracts from Ecomate Holdings Bhd’s Prospectus for its 2021 IPO illustrate the positive picture of the industry.
- Malaysia manufactures several types of furniture products…However, in terms of value…wooden and cane furniture is the largest segment. This is due to the abundance of tropical wood found in Malaysia, where approximately 80.0% of furniture exports are manufactured from rubberwood.
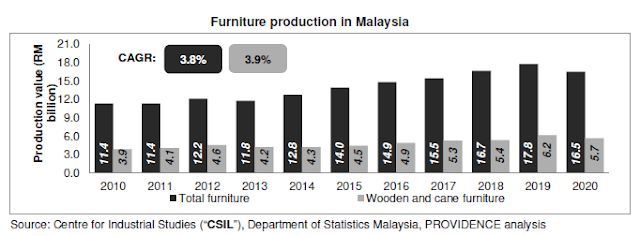
- Between 2010 and 2019, the production of furniture in Malaysia grew…at a CAGR of 5.1%…The production of wooden and cane furniture…grew at a CAGR of 5.3%.
 |
| Chart 3: Malaysian Furniture Production |
- Malaysia’s furniture manufacturers are primarily located in the states of Johor and Selangor, with the Muar district considered to be the country’s major production base, producing about two-thirds of Malaysia’s furniture exports.
- Between 2010 and 2019, Malaysia’s furniture exports increased from RM 8.0 billion to RM 11.1 billion at a CAGR of 2.7%...Malaysia’s furniture imports also witnessed growth over the same period, increasing from RM1.3 billion to RM3.1 billion at a CAGR of 9.9. Malaysia is still a net exporter of furniture.
The Malaysian furniture industry has consistently contributed about 0.3% to 0.4 % to the Malaysian GDP. As such you should not be surprised to find out that there are more than 2 dozen furniture companies listed on Bursa Malaysia.
Base rates for the furniture sector
I spent a considerable part of my corporate life working in a Bursa Malaysia listed furniture group. With this background, I have occasionally invested in some of the Bursa Malaysia furniture company stocks.
I am a value investor and my investments are based on fundamental analysis of the companies. This is where the base rates of the sector come in.
If you want to understand more about base rates refer to the following articles:
In this post, base rates for the furniture sector refer to the performance of 21 furniture companies under Bursa Malaysia. While I have identified 25 companies in this sector, 4 of them did not have financials from 2010 to 2020. As such the base rates covered only 21 companies. Refer to the Methodology. Note that in the post, I have used the terms "sector" and "industry" interchangeably.
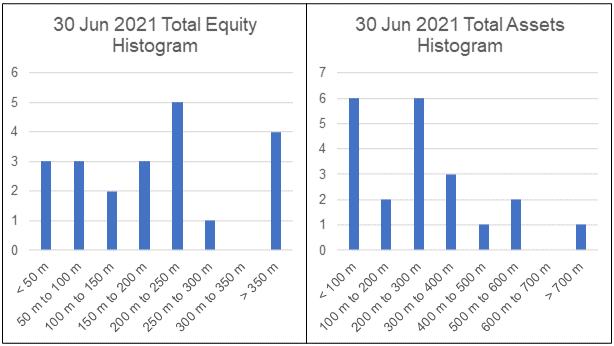
The profile of the 21 furniture company stocks in terms of the Shareholders’ Funds and Total Assets as of mid-2021 are shown in the following 2 histograms.
 |
| Chart 4:Furniture Sector Total Equity and Total Assets histogram |
- The companies in the sector are relatively small compared to the component companies of the KLCI. About half of the furniture companies had Total Equity (SHF + MI) of less than RM 200 million each. Contrast this with the KLCI component companies where the smallest component company had a Total Equity of about RM 550 million.
- The Total Equity of the companies in the furniture sector averaged RM 206 million as of mid-2021. The Total Assets averaged RM 278 million.
The growth of the Total Assets and Total Equity for the sector can be seen from the charts below where I have plotted the sector average and quartile values.
 |
| Chart 5: Furniture Sector Total Equity and Total Assets Trends |
- The industry average Total Assets grew at 6.0 % CAGR from 2010 to 2020.
- The industry average Total Equity grew at 7.8 % CAGR from 2010 to 2020.
From an investment perspective, the furniture sector did not perform well as the industry average ROE declined from 7.9 % in 2010 to 4.5% in 2020.
Revenue and PAT
The total revenue for these 21 companies in 2020 amounted to about RM 4.73 billion. This is about 29 % of the total furniture production in Malaysia. From 2010 to 2020, the industry average revenue grew at 3.6 % CAGR.
 |
| Chart 6: Furniture Sector Revenue and PAT Trends |
The industry average PAT grew at a CAGR of 1.9 % from 2010 to 2020. As can be seen from the charts, the industry average revenue and PAT did not seem to be affected by the Covid-19 measures in 2020.
The PAT grew from 2010 to peak in 2016 and had not been able to match the peak values since then. The past 11 years of PAT showed a “humped” profile.
Returns
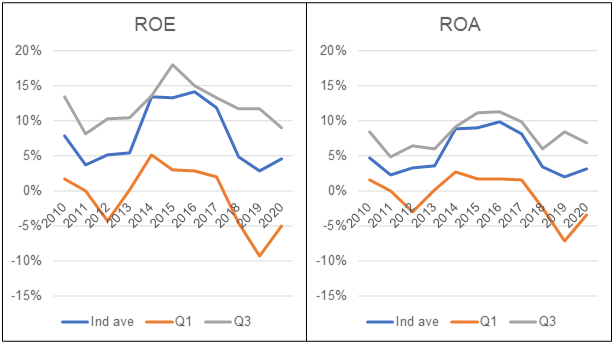
I looked at returns from both the ROE and ROA perspectives. Given the growth of the PAT, the results of the returns were surprising. From 2010 to 2020:
- The industry average ROE declined at a compounded 5.5 % per annum.
- The industry average ROA declined at a compounded 3.9 % per annum.
 |
| Chart 7: Furniture Sector Returns |
The declining returns given the positive growth in PAT were because the Total Equity and Total Assets grew at a faster rate than the growth in PAT.
Note that the industry average ROE and ROA have a similarly peaking pattern as that for the industry average PAT. It suggests that changes in profits had a greater impact on the returns than changes in Total Equity or Total Assets.
I also carried out a DuPont analysis of the ROE to get an understanding of what drove the decline in ROE. As can be seen from Table 1, there were contributions by declining net Profit Margins, Asset Turnover and Leverage.
 |
| Table 1: Furniture Sector DuPont Changes |
But if you look at the profile of the components of the DuPont analysis, you can see that the changes in Profit Margins seemed to mirror the changes in ROE.
Debt
I looked at the following metrics to gauge the loan position of the sector.
- Leverage is as Total Assets/Equity. The industry average Leverage declined by about 1.7 % compounded rate per annum from 2010 to 2020.
- Debt to Equity. The industry average Debt to Equity ratio declined by a compounded annual rate of 8.1 % from 2010 to 2020.
In other words, the sector had less Leverage and Debt Equity ratio in 2020 compared to that in 2010.
 |
| Chart 8: Furniture Sector Leverage and DE Trends |
Cash from Ops
The sector had a mixed track record when it came to cash flow.
 |
| Chart 9: Furniture Sector Cash Flow Trends |
- The industry average Cash Flow from Operations grew at a CAGR of 1.5 % from 2010 to 2020.
- However, when measured as Cash flow from Ops/Revenue, this metric declined from 4.5 % in 2010 to 3.7 % in 2020. This was because Cash flow from Operations grew at a slower rate than Revenue.
Gross profitability
This is a profitability indicator introduced by Professor Robert Novy-Marx of the University of Rochester. It is computed by dividing Sales minus the Cost of Goods Sold by Total Assets. Gross Profitability has roughly the same power as book-to-market in predicting the cross-section of average returns.
 |
| Chart 10: Furniture Sector Gross Profitability Trends |
The industry average Gross Profitability declined from 19 % in 2020 to 15 % in 2020.
You can see that Gross Profitability increased in the mid-2000 before declining to be below the 2010 level.
The main reason for the Gross Profitability pattern is because of the changes in the Gross Profit Margins rather than the changes in the Total Assets.
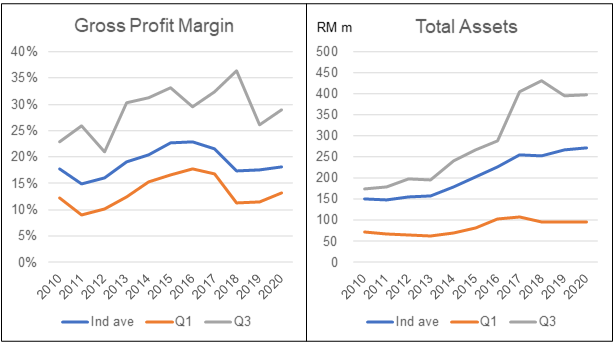 |
| Chart 11: Furniture Sector Gross Profit Margin and Total Assets Trends |
Email me at i4valueasia@gmail.com if you want the industry charts presented in the video.
Screening for the better stocks
You can see from the PAT and ROE charts that the industry had a “humped” performance over the past 11 years:
- The were 4 years of peak performance from 2014 to 2017.
- The 2020 performance was close to that of 2010.
- The industry performance did not seem to be affected by Covid-19.
If you were a long-term fundamental investor, 2 questions come to mind:
- What caused the hump and will the industry regain the peak performance?
- Which are the furniture company stocks that bucked the trend?
At the industry peak PAT in 2017, 7 companies accounted for 83 % of the industry PAT. Chart 12 showed the PAT of these 7 companies compared to the industry from 2010 to 2020.
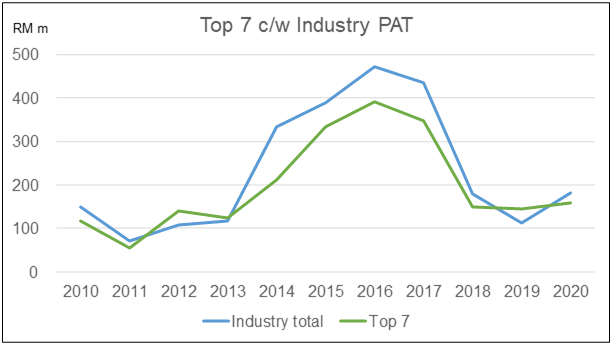 |
| Chart 12: Top 7 Furniture Companies PAT c/w Industry Note: In certain years, the profits from the Top 7 exceeded the industry profits as there were some companies that incurred losses in these years. |
These 7 companies in (in alphabetical order) were
- HEVEA
- HOMERIZ
- LATITUD
- LIIHEN
- POHUAT
- SIGN
- SYF
The "hump"
When I looked into the detailed performance of these 7 companies, I found that except for SIGN which depended mainly on domestic sales, there were 2 common reasons for the spike in PAT in 2014/15 compared to the previous year.
- A growing economy of the importing countries. A good example of this is the US which accounted for 60 % of the total Malaysian exports in 2020. (Source: Ecomate Prospectus). As can be seen from Chart 13, the US had been experiencing steady GDP growth. The only hiccup was in 2020 due to Covid-19.
- A jump in the exchange rate. Chart 14 showed that the exchange rate increased from about RM 3.25 to 1.00 USD in 2012/13 to about RM 4.25 to USD 1.00 in 2016. This is about a 30% increase.
 |
| Chart 13: US GDP Source: FRED |
 |
| Chart 14: USD to RM Exchange Rates Source: CEICDATA |
The following excerpts from the 2014 or 2015 Annual Reports of some of the furniture company stocks illustrate this picture:
- “The increase in revenue of the Group was mainly the results of larger volume orders from Asian and US markets, higher production output as well as strengthening of US Dollar against Ringgit Malaysia.” LIIHEN 2015 Annual Report
- “The significant improvement of revenue of the Group was mainly due to increase in monthly production…and strengthening of US Dollar against Ringgit Malaysia.” LATITUD 2014 Annual Report
I would conclude that forex accounted for a big part of the jump in profits in 2015/16. You can see that the exchange rate remained above RM 4.00 to USD 1.00 from 2016 onwards.
Then the reasons for the dip in 2018 were lower demand and higher operating costs as the following extracts illustrate:
- “The Group’s gross profit decreased by 35.8%...The substantial decrease in gross profit was in line with the decrease in revenue, higher average prices of raw materials, higher sales of lower margin products and higher labour costs in Vietnam plant due to increase in minimum wages.” LATITUD 2018 Annual Report
- “…a challenging year for Hevea Board as we were faced with prolonged challenges such as the shortage of foreign workers as well as the onslaught of the trade war between China and USA which had impacted the particleboard sector.” HEVEA 2018 Annual Report
The conclusion is that the jump in profits in 2014/15 appeared to be a one-off event. Further profit growth for the sector moving forward from 2020 would have to depend on demand growth. The sector also has to resolve the various operating issues.
Bucking the trend
If you looking for stock-picking opportunities, you would be looking for companies that bucked the industry trend. In other words, were there companies that had continued profit growth after 2017/18?
To assess this, I compared the respective average PAT from 2018 to 2020 with the average PAT from 2014 to 2016. Their results were:
- Of the 7 top companies, only 2 had higher average PAT from 2018 to 2020.
- Of the others, only 6 had higher average PAT from 2018 to 2020.
Screening for the better companies
As a fundamental investor, you should not only look at PAT growth, but also other metrics when screening for potential investments.
I used the following metrics as screens. Refer to the Definitions if you are not familiar with them.
- ROE. This is considered a gauge of a corporation's profitability and how efficient it is in generating profits. I set ROE > 10 % for the screen.
- Beneish M Score. This is a mathematical model that uses eight financial ratios to identify whether a company has manipulated its earnings. A score greater than - 1.78 suggests a high likelihood of manipulation. I use M-Score < - 1.78 for the screen.
- Piotroski F Score. This ranged from 0 to 9 to indicate the strength of a company’s financial position with 9 being the best. I used F-Score > 4 for the screen.
- Altman Z Score. This is a formula for determining whether a company, notably in the manufacturing space, is headed for bankruptcy. A score close to 1.8 suggests a company might be headed for bankruptcy, while a score closer to 3 suggests a company is in solid financial positioning. I used Z-Score > 3 for the screen.
While all the 3 “Scores” made sense, the shortcoming is that they focused on the current or past year results. I am a long-term value investor holding onto the stock for 6 to 8 years. As such I am interested to see how companies perform over the next decade.
To enable this, the metrics used are based on “normalized” values over the cycle. Generally, I based the normalized values on the past 10 to 12 years of data as these would cover at least one business cycle. For commodity companies, the 10 or 12 years would cover several cycles.
Whenever I talk about cyclical companies, I am not talking about companies that are affected by the business cycle as all are affected. Rather I refer to those whose performance follows some commodity price cycle or some other pattern rather than the business cycle.
As such, I generally avoid using Beneish M Score, Piotroski F Score, and Altman Z Score on my screens. Rather I focused on those that gave a longer trend picture.
The values of the various metrics for the 21 companies are shown in Table 2.
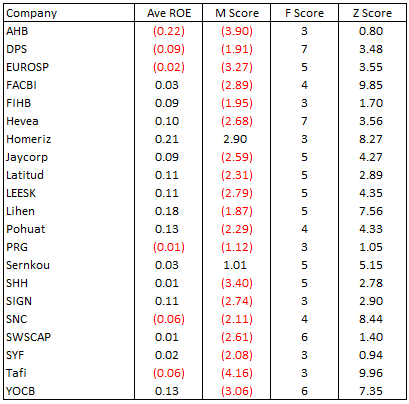 |
| Table 2: Furniture Screen Scores |
To assist in the screening, I set up a condition table where those that passed the criteria had a score of 1. I then added up the score for each of the companies. The results for these 21 companies are shown in Table 3. I looked for those with a total score of 4.
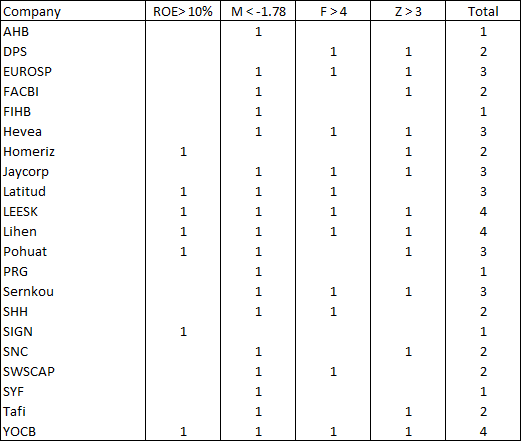 |
| Table 3: Furniture Screen Go No-go Score |
3 companies passed all 4 metrics criteria. They were
- LEESK
- LIIHEN
- YOCB
I would recommend that if you are interested in investing in any Bursa Malaysia furniture company stocks, dig deeper into these 3. The following charts showed the performance of these 3 companies compared to the industry average.
 |
| Chart 15: Screened Furniture Companies Revenue and PAT Trends |
 |
| Chart 16: Screened Furniture Companies ROE and Gross Profitability Trends |
I have carried out a fundamental analysis of 2 of the companies and have invested in one of them. For details refer to:
Methodology
I identified 25 Bursa Malaysia furniture company stocks whose main business were in the manufacturing or marketing of furniture and/or furniture components. Refer to Appendix 1 for the list of companies.
Of these, 4 companies did not have the full financials from 2010 to 2020. As such I have excluded them from the analysis. They were ECOMATE, MOBILIA, SPRING and WEGMANS. Thus the base rates covered only the 21 companies.
The data for the base rates were extracted from the Financial Statements for each company for the period 2010 to 2020. Note that it is comprised of companies with different financial year ends.
For the 2022 update, I focussed on the 21 companies with data from 2010 to 2020. In the original analysis, the 2021 data were the TTM data. For the updates the 2021 and 2022 data were actual results.
I did not cover all the analyses for the update. Instead, I covered only revenue, gross profit, PAT, and Total Assets. The goal was to see what had changed over the past 2 years and these metrics were sufficient to give me a picture of the changes.
The Financial Statements were taken from a platform/app called TIKR. It has been described as “The 1 Stop Platform To Do All Your Stock Market Research On”.
I have 2 types of analyses:
- The industry average (referred to as “Ind ave” in the charts). This is the average for the 21 companies making up the sector.
- The distribution of individual companies making up the sector. For these, I extracted the quartiles for each year based on the ranking of the respective metric. Q1 refers to the lower or 1st quartile and Q3 refers to the upper or 3rd quartile
I have the following example to illustrate the difference between these 2 types of analysis.
Suppose that there are 9 companies in the sector with the Revenue, PAT, and Profit margin (PAT/Revenue) as shown in the table below.
 |
| Table 4: Sample |
To get the distribution of the Profit margin, the companies are ranked (from largest to smallest) based on profit margin with the results below.
This is then used to determine the quartiles and median values.
The average profit margin for the sector or industry average is derived by dividing the total PAT for the sector by the total revenue.
Industry average profit margin = 121 / 865 = 14.0 %.
You can also get the average profit margin by adding up individual company profit margin (132.3) and dividing by 9 = 14.7 as shown in the table.
There are then 2 average profit margins for the sector.
• The 14.0 % is looking at the performance of the sector as a whole.
• The 14.7 % is looking at the distribution of individual profit margins.
The values are different because we are looking from different viewpoints. In my analysis I am more interested in the former.
Base rates details
The information on the base rates presented in this article is a summary of the various metrics. There are a lot of details with me. Different investors look for different things when analysing companies. As such if you need specific details, do feel free to contact me at i4valueasia@gmail.com.
For a fundamental investor, base rates are important as they help ensure that the assumptions used in the analysis and valuations are realistic. If you do not have such information but still want to invest based on fundamentals, one way is to rely on third-party analysis and valuation.
Several financial advisers provide such analyses. Those who do this well include people like Seeking Alpha.* Click the link for some free stock advice. If you subscribe to their services, you can tap into their business analysis and valuation.
Appendix 1 - List of Bursa Malaysia furniture companies
AHB
DPS
ECOMATE
EUROSP
FACBI
FIHB
HEVEA
HOMERIZ
JAYCORP
LATITUD
LEESK
LIIHEN
MOBILIA
POHUAT
PRG
SERNKOU
SHH
SIGN
SNC
SPRING
SWSCAP
SYF
TAFI
WEGMANS
YOCB
End
- - - - - - - - - - - - - - - - - - - - - - - - - - - - - - - - -
How to be an Authoritative Source, Share This Post
|
Disclaimer & Disclosure
I am not an investment adviser, security analyst, or stockbroker. The contents are meant for educational purposes and should not be taken as any recommendation to purchase or dispose of shares in the featured companies. Investments or strategies mentioned on this website may not be suitable for you and you should have your own independent decision regarding them.
The opinions expressed here are based on information I consider reliable but I do not warrant its completeness or accuracy and should not be relied on as such.
I may have equity interests in some of the companies featured.
This blog is reader-supported. When you buy through links in the post, the blog will earn a small commission. The payment comes from the retailer and not from you.


Comments
Post a Comment