Petron Malaysia is still not a value trap
Value Investing Case Study 05-4: Petron Malaysia: Resilient amidst oil price volatility. I first covered Petron Malaysia in Oct 2020. This is an updated fundamental analysis taking into account the financials till FYE 2022. Where relevant, I have incorporated the analyses from the previous articles here.
On 1st Oct 2020, Petron Malaysia Refining and Marketing Berhad (Petron Malaysia or the Group) was trading at RM 3.26. At that juncture, I estimated its NTA to be RM 5.93 (as of 30 June 2020). I had presented my rationale for why Petron Malaysia was not a value trap then.
Petron Malaysia is today trading at RM 4.52 per share (30 Oct 2023) compared to its NTA of RM 8.51 per share (as of 30 Jun 2023). The market price had gone up by 9 % while its NTA had gone up by 44 %.
The Group incurred losses in 2020 due to the measures taken to control Covid-19. With that behind us, the Group managed to turn around in 2021 with improved profitability in 2022.
You should not be surprised that I do not consider Petron Malaysia a value trap. It is still one of the better Bursa Malaysia stocks to invest in.
At the current price, there is still an investment opportunity. Should you go and buy it? Well, read my Disclaimer.
Contents
- Investment thesis
- Rationale
- Business background
- Operating trend
- Financial position
- Risks
- Valuation
- Petron Malaysia is not a value trap
- Appendix 1. Expansion efforts
|
Investment Thesis
As of 30 Oct 2023, Petron Malaysia was trading at about half of its Asset Value and EPV. With the Asset Value about the same as the EPV, I have great confidence in the margin of safety.
The Group suffered due to the measures taken to control Covid-19. With this behind us, it should deliver better profitability. However, this was impacted by high crude oil prices.
Historically Petron Malaysia did better when crude oil prices were around USD 60 per barrel. Oil prices are cyclical and I have accounted for the cyclical prices by using the past 12 years' performance in my valuation.
The Group is financially sound and while there is the threat of the disruption of the petrol station business model, it is not imminent.
|
Rationale
- Petron Malaysia is financially sound with a 30 % debt-equity ratio and 10% of its total assets as cash and marketing securities.
- Over the past 11 years, it has managed to achieve an average ROE of 10%. But this was volatile ranging from – 7% to + 27%.
- The Group has a good capital allocation track record. It also has a good track record for creating shareholders' value from a business perspective.
- There is enough margin of safety based on the Asset Value and EPV.
- Historically the Group did not do well when oil prices were high. It performed better when oil prices were around USD 60 per barrel. In my valuation of Petron Malaysia, I have taken the average performance over the past 12 years. These covered a period when crude oil prices ranged from under USD 60 per barrel to over USD 100 per barrel.
The supporting details are presented in the following sections.
|
Business background
Petron Malaysia is part of Petron Corporation (Petron Corp) of the Philippines. Petron Corp is the largest integrated oil refining and marketing company in the Philippines.
In March 2012 Petron Corp acquired ExxonMobil’s downstream businesses in Malaysia. Petron Corp’s subsidiaries in Malaysia today comprise:
- Petron Malaysia which is listed on Bursa Malaysia.
- Petron Fuel International Sdn. Bhd. offers retail and commercial fuels and serves customers worldwide. This is a sister company of Petron Malaysia.
- Petron Oil (M) Sdn. Bhd. The Company's business includes the wholesale distribution of petroleum and petroleum products. This is another sister company of Petron Malaysia.
- Petron Oil & Gas International Sdn. Bhd. This is the immediate holding company of Petron Malaysia.
Petron Malaysia traces its rich heritage to 1893 when it was first established as the Standard Vacuum Oil Company.
- It opened its first service station in Malaysia in 1921.
- Construction of the Port Dickson refinery was started in 1961 and commenced operations in 1963.
Along the way, Petron Malaysia experienced many significant changes. These included mergers and acquisitions, shaping it into part of ExxonMobil and finally part of Petron Corp.
Today Petron Malaysia and its sisters’ facilities include:
- The Petron Port Dickson Refinery which has a rated capacity of 88,000 barrels per day. It produces a wide range of petroleum products eg gasoline, diesel, liquefied petroleum gas (LPG), and aviation fuel.
- 12 strategically located depots and affiliated terminals.
- 750 service stations throughout Malaysia. Note that the majority of these are directly owned by Petron Malaysia.
- Petron Malaysia also owns the Lumut crude oil refining plant. This is a 90,000 tons per year Palm Oil Methyl Ester (POME) plant.
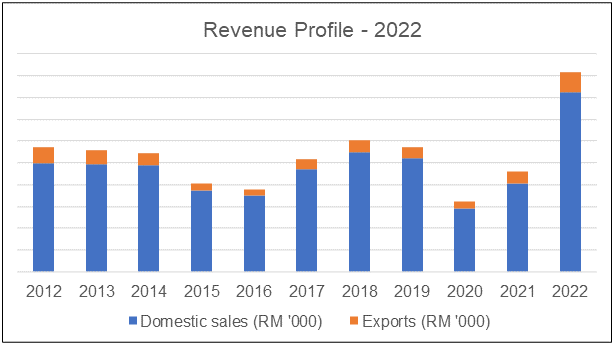
About 90% of its 2022 revenue was generated from domestic sales with the balance exported. Refer to Chart 1. You can see that over the past 11 years, the revenue was the lowest in 2020. But the 2022 revenue was an 11-year record.
 |
| Chart 1: Revenue trends |
In Malaysia, its main market segments are:
- Transportation - served by the service stations network.
- Households with its LPG.
- Commercial with its industrial fuel products.
|
Operating trends
I looked at 3 metrics to get an overview of the overall performance – revenue, PAT, and gross profitability (gross profits / total assets). Refer to Chart 2.
- Revenue over the past 11 years showed a cyclical pattern. Revenue grew at 4.8 % CAGR. As will be shown later a large part of this was price driven. To deliver revenue growth, the Group undertook considerable marketing and expansion efforts. Refer to Appendix 1 for some examples.
- PAT was relatively volatile with the Group incurring losses in 2013, 2014, and 2020.
- PAT peaked in 2017 but declined in 2018. According to the Group, this was “…mainly due to the significant inventory losses caused by the sudden drop in oil prices in the fourth quarter.”
The concern was that while gross profitability improved from 2015 to 2017, it had been declining since then. The 2022 gross profitability was lower than that in 2012.
 |
| Chart 2: Performance Index |
The volatile PAT resulted in a volatile ROE. Over the past 11 years, the ROE ranged from – 7 % to + 27 % with an average of 10 %.
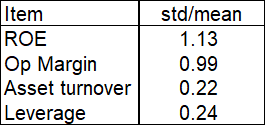
Table 1 gives you a sense of the volatility over the past 11 years. Both the ROE and Op Margin had very high volatility, as measured by the standard deviation compared to the mean.
 |
| Table 1: Standard Deviation/Mean |
A DuPont analysis as per Chart 3 showed that the bulk of the ROE volatility can be linked to the volatile Op Margin. There was a 96 % correlation between the ROE and the Op Margin.
Asset turnover also showed a declining trend. Together with the declining gross profitability, they showed that there were no improvements in the operating efficiencies.
But leverage had improved as shown by the declining trend line.
 |
| Chart 3: DuPont Analysis |
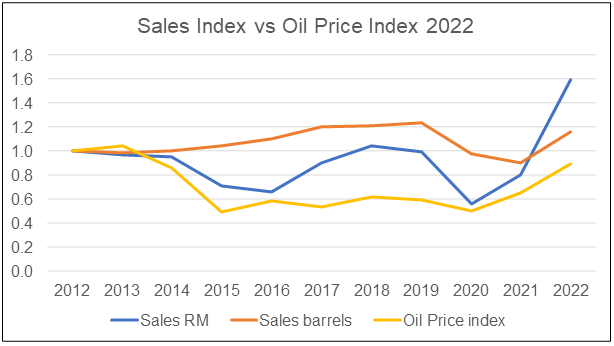
We have been experiencing volatile oil prices over the past few years. To wash out the effect of the oil prices, I compared the Group sales (RM revenue and number of barrels sold) with the crude oil prices. Refer to Chart 4.
While RM revenue grew at 4.8 % CAGR from 2012 to 2022, the number of barrels sold only grew at 1.5 % CAGR. You can attribute the RM revenue growth to changes in oil prices.
You can see the impact of the oil prices.
- From 2012 to 2015, oil prices declined. While there was an increase in the number of barrels sold, it was not sufficient to offset the impact of lower oil prices.
- From 2020 to 2022, both crude oil prices and the number of barrels sold grew boosting revenue.
Looking at the number of barrels, I would not consider Petron Malaysia as a high-growth company.
 |
| Chart 4: Revenue (RM sale and barrels sold) vs Oil Price Note: The crude oil prices for each year were based on the Brent crude prices from Macrotrends at the start, middle, and end of each year. |
IH 2023
The revenue and PAT for the first six months of 2023 were 16% and 49 % lower respectively than those for the same period last year.
You can trace the lower profits to the lower gross profit margin. The gross profit margin for the first 6 months of 2023 was 3.7 % compared to 7.0 % last year. This was attributed to lower oil prices and regional refining cracks.
But sales volume in terms of the number of barrels sold in the first half of 2023 grew by 9% compared to the first half of 2022.
I am a long-term value investor and I consider quarterly performance as “noisy”. As such I focus on long-term trends.
Competitive profile
Currently, there are two other Bursa listed company involved in the marketing, sales, and distribution of petroleum products:
- Petronas Dagangan Berhad which operates in the same market segments as Petron Malaysia.
- Boustead Holdings Berhad which operates the BHP petroleum retail network. However, Boustead is reported to be seeking buyers for its BHP petroleum retail business.
Boustead Holdings does not provide a separate report for its BHP operations. Rather it is reported as part of the trading segment operations which included building materials.
As such I only compared Petron Malaysia's performance with that of Petronas Dagangan. Refer to Chart 5.
Petronas Dagangan is a much bigger company than Petron Malaysia. In 2022 Petronas Dagangan's revenue was double that of Petron Malaysia. But Petron Malaysia's revenue grew at 4.8 % CAGR over the past 11 years compared to the 2.2 % CAGR for Petronas Dagangan. Both showed similar cyclical patterns.
Over the past 11 years, Petron Malaysia's ROE averaged 10% compared to the 14 % ROE for Petronas Malaysia. But Petron Malaysia's ROE was more volatile. And there were 3 years when it outperformed Petronas Dagangan.
 |
| Chart 5: Peer comparison |
Over the past 11 years, Petron Malaysia has grown its sales of physical products by 1.5 % CAGR. At this pace of growth, it is unlikely that it took some market share from its competitors because:
- The consumption of oil in Malaysia grew from about 758,000 barrels per day in 2012 to 894,000 barrels per day in 2022, equivalent to a CAGR of 1.7%.
- Petron Malaysia's market share in terms of barrels per day decreased from 10.6 % in 2012 to 10.4 % in 2022.
I would say that Petron Malaysia has been able to compete with Petronas Dagangan.
Financial position
I would rate Petron Malaysia as financially sound based on the following:
- As of the end of Jun 2023, it had RM 427 million cash and short-term securities. This was equivalent to 9 % of its total assets.
- It had a debt-equity ratio of 30 % as of Jun 2023. This is much lower than its peak debt-equity ratio of 130 % in 2014.
- Over the past 11 years, there were 3 years where it had negative cash flow from operations.
- Over the past 11 years, it generated RM 2.2 billion cash from the cash flow from operations compared to RM 1.8 billion of PAT. This is a very good cash conversion ratio.
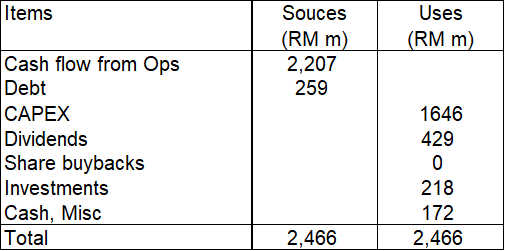
The Group also had a good capital allocation plan as shown in Table 2. You can see that its cash flow from operations was well deployed for CAPEX and dividends.
 |
| Table 2: Sources and Uses of Funds - 2012 to 2022 |
Shareholders’ value creation
I looked at the following metrics when assessing shareholders’ value creation:
- Comparing returns with the cost of funds.
- Comparing the gains by an investor who bought a share at the end of 2011 with the cost of equity.
- Looking at the Q Rating which is based on several valuation metrics. A high score relative to the panel meant that the company had the potential to create shareholders’ value.
As can be seen from Table 3, Petron Malaysia returns were higher than the respective cost of funds for the first 2 metrics. It only did badly when it came to market prices. From a business perspective, the Group was able to create any shareholders’ value.
 |
| Table 4. Estimating the shareholders’ gain |
At the same time, Petron Malaysia had an overall Q Rating of 0.41. This places it just below the average position among the panel companies. You can see that it did well in the growth and financial ratings.
On the negative side, the Q Rating had declined from 0.50 in 2020.
 |
| Chart 6: Q Rating |
Risks
I look at risks through the following lenses:
- Crude oil prices.
- Privatization.
- Disruption of the fuel retail industry.
- Automatic Price Mechanism.
Link to crude oil prices
Oil prices have been cyclical as can be seen from Chart 7. While prices in 2023 have been high, it was not the historical high which occurred in 2012/14.
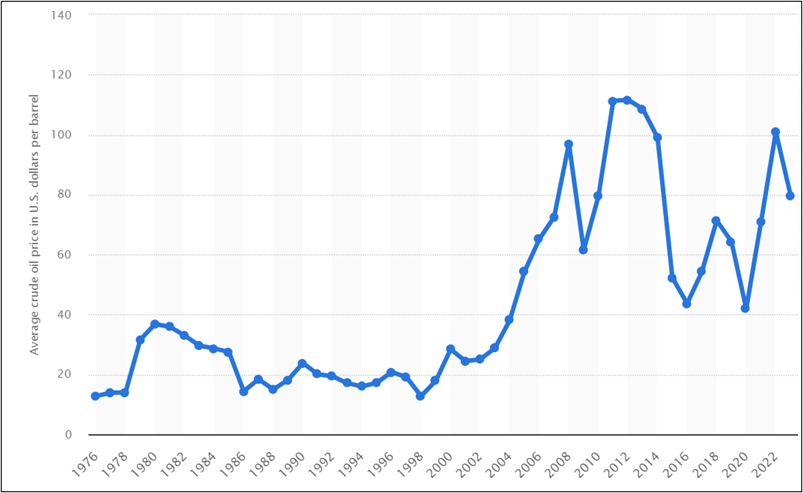 |
| Chart 7: Brent Crude Oil Price. Source: Statista |
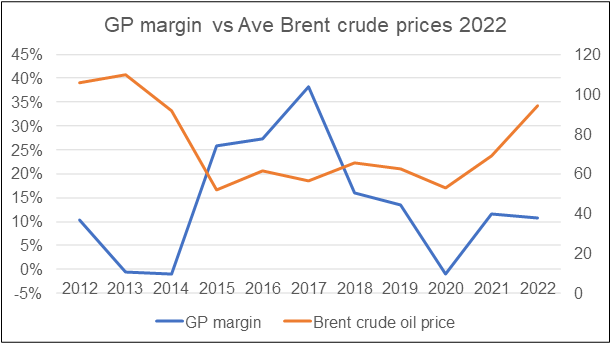
As an oil & gas company, you may think that the performance of the Group would be linked to the global oil prices. However, the link is not so clear partly because Petron Malaysia is also a refinery where the margins are generally squeezed as crude oil prices increase.
The other reason why the linkage between profits and crude oil prices is not so clear is that petrol prices in Malaysia are regulated.
The chart below illustrates how Petron Malaysia experienced low gross profit margins when crude oil prices were in the USD 100 per barrel price range. Its gross profit margins improved when crude oil prices were in the USD 60 range.
 |
| Chart 8: Petron Malaysia Gross Profit Margin vs Brent Crude Oil Pric |
Of course, the profits of the Group would also be affected by the physical volume of sales. Excluding the pandemic year, the sales volume had been growing.
I had earlier shown in Chart 4 that Petron Malaysia Ringgit sales had some link to oil prices. But the sales volume in terms of barrels of oil did not show any linkage.
What does this all mean for Petron Malaysia going forward?
I would expect a continuation of the growth that was experienced from 2012 to 2019. This would be supported by the growth in the number of service stations.
Secondly, the Group's performance was better when the crude oil prices were around USD 60 per barrel. Its prospects depend on how you view oil prices.
The US Energy Information Administration's expects the average Brent crude prices to be:
- USD 61 per barrel in 2025.
- USD 88 per barrel in 2035.
- USD 91 per barrel in 2045.
As such I would not expect a fantastic performance. But looking at the above forecast for the price of crude oil, it does not look much different from the past 11 years. The Group should not do any worse than what it achieved over the past 11 years.
Privatization
I have mentioned in my other articles that at the current market prices, it is very attractive to take companies private.
Can you rule out privatization here?
- In its General Offer in 2012 following the purchase of Petron Malaysia from ExxonMobile, San Miguel stated that it did not intend to maintain the listing status if there was a shortfall in the public spread. Note that the offer price then was RM 3.59.
- It would cost San Miguel/Petron Corp about RM 330 million to acquire the remaining 27% of the shares it does not own at RM 4.52 per share.
- This is a small sum for the parent company. Recall the amount that has been reinvested into the business. Also, over the last 11 years, the parent company has received about RM 374 million for its share of dividends declared.
In mitigation, I would point out that there was no privatization exercise when the stock was trading at its 5-year low of RM 3.37 per share. Today it would cost about 34 % more to privatize it. I do not think it makes sense to privatize it at a higher price.
Disruption of the fuel retail industry
In its Jun 2021 article titled “What are the trends disrupting the fuel-retail industry?” McKinsey & Company opined the following:
“…the fuel value pool will decline, driven by fuel efficiency and the substitution of traditional internal-combustion-engine cars by electric vehicles…Nonfuel retail will continue to grow…driven by general grocery growth…
However, the speed at which this transition will happen will differ dramatically around the world. In China and developed countries, the fuel value pool will decline at 2 to 3 percent CAGR…transition will happen at a slower pace in developing countries, in which the fuel demand will stay relatively flat…”
Another consulting group, Arthur D Little also painted a disruptive future for the industry.
“The traditional forecourt model is at its inevitable end. Electric vehicles (EVs), autonomous cars, data analytics, and the Internet of Things (IoT) are only a few of the emerging technologies threatening the classic fuel-station customer experience.”
While both reports are in the context of the global fuel retail industry, Malaysia is not immune to them.
The best analogy is how the Malaysian media and taxi sectors succumbed to the same disruption suffered by these industries in developed countries.
Even Petronas Dagangan has recognized this changing environment. Its 2019 Annual Report stated that higher usage of public transportation and the push toward EVs is leading to waning fuel demand.
If you want evidence of this waning demand look at the chart below. It shows that the vehicular traffic volume in Malaysia has not shown any significant growth since 2015.
 |
| Chart 9: Malaysia vehicle registration Source: data.gov.my |
For the fuel retail industry in Malaysia, it is not whether the disruption will occur. It is when.
Taking a leaf from what has happened to the media and taxi industries, there are two possible scenarios:
- The first is the “traditional” industry being in a secular decline. This is what is happening to the media and taxi sectors in Malaysia.
- The second is for the existing players to re-invent themselves. A good example of this is the Malaysian food retailers that have adopted online ordering with delivery via Grab.
Whether Petron Malaysia will reinvent itself remains to be seen. However, there are 3 positive things for them.
- It will have to reinvest. Given its reinvestment track record, this should not be an issue.
- It sees itself as a sales and marketing company. This mindset may give it a first-mover advantage to re-invent the fuel retail network.
- Petronas is the dominant player in Malaysia and like the taxi industry, there will be political-economic forces to delay the effects of the disruption. This may buy Petron Malaysia time to re-invent itself.
Automatic Pricing Mechanism (APM)
In Malaysia, petrol and diesel are “controlled goods” where their prices are regulated by the government.
In place since the 80s, the APM is the Malaysian government’s formula to regulate petrol and diesel prices.
The initial APM formula had a sales tax or fuel subsidy component that was sort of set at the discretion of the government.
APM Formula = MOPS + Operation Costs + Profit Margin Oil Companies + Profit Margin Petrol Dealers + Alpha + Sales tax or fuel subsidy.
- MOPS = Mean of Singapore’s Platt oil prices. The formula meant that the refinery costs were already included and indexed in the MOPS.
- The operations cost, profit margin, and Alpha is intended to cover the sales, marketing, and distribution portion.
In 2010, the subsidy for the premium grade of petrol was removed.
In 2014, a managed float system was introduced following the removal of the sales tax/fuel subsidy in light of the reduction in crude oil prices. Initially, this was reviewed monthly but was later changed to weekly.
With the removal of the sales tax/fuel subsidy, the government “lost” one way to regulate the retail prices via the APM. However other measures were adopted
- In the weeks leading up to the 2018 Malaysian election, the retail prices were frozen.
- In 2019, the new government decided to bring back the APM while at the same time revising the dealers’ margins. According to the then Finance Ministry, there will also be a cap.
- In Feb 2020, the cap on the retail fuel prices for RON95 and diesel was revised downwards based on the APM.
The APM appears to provide “base profits” for the oil and gas companies. If they could reduce their actual sales, marketing, and distribution costs to be below those in the formula there is a possibility of generating better profits.
Note that the refinery costs have been covered in the MOPS. If the actual refinery cost could be lower than that “imputed” in MOPS, there could be extra margins.
For Petron Malaysia, Malaysia will likely continue to have a regulated petrol and diesel price environment. There are benefits to being more cost-effective than its competitors.
Valuation
My value of Petron Malaysia is summarized in Chart 10.
- I estimated its Asset Value as RM 8.51 per share broken down into Graham Net Net, NTA, and Book Value.
- I estimated its Earnings Value as RM 8.50 per share. This was estimated based on its Earnings Power Value.
At RM 4.52 per share, Petron Malaysia is trading significantly below its NTA of RM 8.51 per share and EPV of RM 8.50 per share.
I would conclude that there is a sufficient margin of safety. It is not a value trap as the existing operations are generating returns.
I would also like to point out that over the past 11 years, it paid an average of RM 0.17 per share as dividends. Based on the current market price, this is about 3.8 % dividend yield. Not fantastic but as good as the bank interest rate.
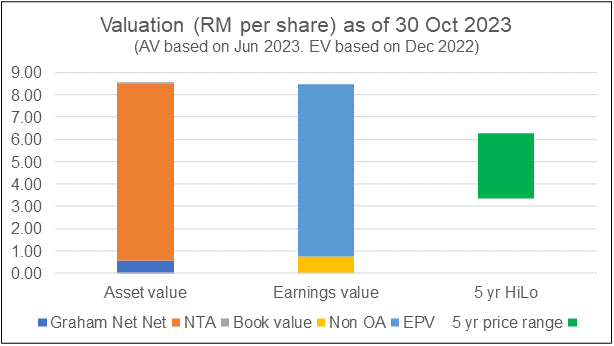 |
| Chart 10: Valuation |
Valuation model
My Earnings Value of the company was derived based on the average values from 2 valuation approaches:
- Free Cash Flow to the Firm model as per Damodaran.
- Residual Income model as per Penman.
For both models, I used the past 12 years’ time-weighted average value to represent the normalized value.
I have taken a conservative view and ignored growth. At the same time, I have used the past 12 years’ time-weighted average EBIT as the earnings.
The cost of capital used in the model was based on the Capital Asset Pricing Model. I followed Damodaran’s approach to determine the Beta and the risk premiums.
These resulted in both 9.8 % cost of equity and 6.8 % WACC.
Why EPV
Petron Malaysia is in a sector characterized by the following:
- Commodity in a mature market.
- Cyclical.
- Regulated market (for petroleum and diesel prices).
The national demand for petroleum products is likely to experience low single-digit growth. At the same time, there are limits to operational improvements. I thus expect that earnings growth will eventually be pegged to the country’s economic growth.
Secondly although prices of its raw material - crude oil - are cyclical, the Automatic Pricing Mechanism (APM) provides some “stability” to its margins.
The above scenario suggests that Petron Malaysia is not a growth stock. Its Earning Power value is probably a more realistic representation of its intrinsic value.
Valuation risks and limitations
You should consider the following when looking at my valuation.
- Cost of capital.
- Continuation of historical performance.
- Greenwald analysis.
The cost of capital was derived based on the risk-free rate and equity risk premium as of 2022. We currently have the Ukraine invasion and the Israel-Gaza conflict. The parameters do not reflect the higher-risk situation.
As such you should see the EPV as an optimistic one. The only mitigating point is that the margin of safety is sufficiently large.
My valuation model assumes that the past 12 years' performance is a good reflection of the future.
- The period included the Covid-19 year. I do not expect such another global disruption.
- At the same time, the past 12 years covered a period when the annual crude oil prices ranged from USD 52 per barrel to USD 110 per barrel.
If you think that the future will be better than the past, then my EPV is conservative. Of course, if you think that the future will be worse, my EPV is optimistic.
|
Greenwald analysis
According to Professor Bruce Greenwald, you can gain strategic insights by comparing the Asset Value with the EPV.
In the case of Petron Malaysia, we have a case where the Asset Value is about the same as the EPV. This indicates that the Group is generating a return that reflects good use of the assets.
Furthermore, with the market price being lower than both the Asset Value and EPV, I have greater confidence in the margin of safety.
Petron Malaysia is not a value trap
A value trap is an investment that while appearing cheap is facing insurmountable problems. It is cheap for a reason. Petron Malaysia does not fall into this category for the following reasons:
- The Group is financially sound and it has a viable business model. I have shown that to some extent, Petron Malaysia’s performance is affected by high crude oil prices. But I have already accounted for this by taking the past 12 years' performance in my valuation.
- Its business in terms of sales of barrels of oil has been growing.
- While there is the threat of a disruption of the petrol station business model, this is not imminent. As such I do not see the assets being in danger of write-offs. The assets are intact and are not going to be impaired due to under-utilization.
- It has been able to generate returns that are more than its cost of capital.
- I have also estimated that there is a sufficient margin of safety from both the Asset Value and EPV.
Appendix 1. Expansion efforts
Some examples of the activities undertaken by Petron Malaysia to grow its revenue:
- The number of Petron service stations has grown from about 550 (former Esso and Mobil stations) in 2012 to 750 in 2022. Not all of these are fully owned by Petron Malaysia. Some were owned by Petron Fuel International and some by Petron Oil (M). The main point is that today there are about 36 % more service stations retailing the Petron brand of gasoline compared to 2012.
- In 2013, Petron Malaysia acquired the LPG business from its sister company Petrol Fuel International Sdn Bhd. The goal was to consolidate and grow the business in Peninsular Malaysia. By 2014 it had 1.6 million Gasul branded cylinders in the market. Today Petron Malaysia supplies LPG to households and restaurants. It was the first to introduce the selling of gas cylinders in service stations.
- The Treats stores at major Petron service stations were introduced in 2012 and there were 200 stores by the end of 2013. By 2018, there were 470 Treats convenience stores and P Kedai marts. Of these, 240 were owned by Petron Malaysia.
- The number of loyalty cardholders (formerly ExxonMobil Smile cardholders) increased from 1.3 million in 2013 to 2 million by 2014. By 2018, there were 3 million members.
- The Petron Fleet card was introduced in 2013 and served 4000 corporate customers in 2014. In 2016, 3000 new cards were added to the base.
- Introduced its Petron Mobile App in 2022 to provide better services and rewards.
End
- - - - - - - - - - - - - - - - - - - - - - - - - - - - - - - - -
How to be an Authoritative Source, Share This Post
|
Disclaimer & Disclosure
I am not an investment adviser, security analyst, or stockbroker. The contents are meant for educational purposes and should not be taken as any recommendation to purchase or dispose of shares in the featured companies. Investments or strategies mentioned on this website may not be suitable for you and you should have your own independent decision regarding them.
The opinions expressed here are based on information I consider reliable but I do not warrant its completeness or accuracy and should not be relied on as such.
I may have equity interests in some of the companies featured.
This blog is reader-supported. When you buy through links in the post, the blog will earn a small commission. The payment comes from the retailer and not from you.


Comments
Post a Comment