Are you looking for US stocks to make money?
Tips B - Other Stock Exchanges. A summary of the fundamental analysis of my 58 curated US-listed companies that I covered prior to 2025. I also used to blog about US companies but in Oct 2023 I have unpublished and redirected them here. Revision date: 30 June 2024
In addition to looking at Bursa Malaysia stocks, I also looked at stocks in other countries. These are mainly US stocks as it has probably the largest stock exchange in the world. The rationale for this is diversification as part of my risk management.
I have a 3-min video summarizing on why I look beyond Bursa Malaysia.
I define a good US stock as one that can enable you to make money. This will usually be a company with strong fundamentals and a sufficient margin of safety.
The first thing that all investors learn is that you have to think in terms of the risk-reward ratio when looking at a particular investment. While every investment has its upside, there is also a potential downside.
One way to take care of the downside when you invest in the stock market is to have a diversified portfolio. There are several perspectives on diversification.
- You can diversify by spreading your investment to different industries and different market caps.
- I also spread my investments based on the various business economic situations faced by companies eg turnarounds and compounders.
- Another common diversification plan is to invest in both local and global companies.
Geographical diversification can be quite nuanced. It is not necessarily about investing in companies that are listed in stock exchanges other than those in your country.
For example, if you are in the US and you invest in NYSE-listed The Coca-Cola Company, you are investing globally as a significant part of The Coca-Cola's revenue are from non-American sources.
Accordingly, while the infographics in this post covered companies that are listed in other stock exchanges (from a Malaysian perspective), it does not necessarily mean that they do not have operations in Malaysia.
Should you go and invest in them? Well, ready my Disclaimer.
Contents
1. Advanced Drainage Systems
2. Alcoa
3. Aptar Group
4. Arconic
4. Arconic
6. BlueLinx
7. Boise Cascade
7. Boise Cascade
8. Builders FirstSource (BLDR)
9. Capstone Green Energy
9. Capstone Green Energy
11. Century Aluminum
12. Constellium
12. Constellium
13. Core Molding Technologies
14. Cummins
14. Cummins
16. eXp World Holdings
17. Generac
18. Graphic Packaging
19. Innovative Industrial Properties
18. Graphic Packaging
19. Innovative Industrial Properties
21. Kaiser Aluminum
22. KB Home
23. Leggett & Platt
24. Lennar
22. KB Home
23. Leggett & Platt
24. Lennar
26. Masonite (DOOR)
27. MDC
28. Meritage Homes
29. M/I Homes
27. MDC
28. Meritage Homes
29. M/I Homes
31. NVR
32. Olympic Steel (Zeus)
33. Orion Office REIT
34. PGT Innovations
35. Pulte
36. Reliance Steel & Aluminum
36. Reliance Steel & Aluminum
37. Ryerson Holding
38. Sealed Air Corp
39. Silgan
41. Sleep Number
42. Smurfit Kappa
43. Stelco
44. Steel Dynamics
44. Steel Dynamics
46. Trane Technologies
47. Tempur-Sealy
48. Ternium
49. Timken Steel
50. Toll Brothers
51. TopBuild Corp
51. TopBuild Corp
52. Tredegar
53. Universal Steel & Stainless
54. US Steel
54. US Steel
56. Walgreen Boots Alliance
57. WestRock
58. Worthington Industries
|
Case Notes When I value a non-Malaysian company, I have to use different data for computing the cost of capital. The differences are for the following parameters:
So you should not be surprised to see a different cost of capital for a US company compared to a Malaysian company even if both companies are in the same industry, of the same size with the same debt to equity level, and have similar risks. For beginners, it can be challenging to take into account these differences when valuing companies from different countries. If you still want to invest in companies in other countries based on fundamentals, and you are not familiar with the adjustments to be made it may be better to rely on third-party analyses. Several financial advisers provide such analyses. Those who do this well include people like Seeking Alpha.* Click the link for some free stock advice. If you subscribe to their services, you can tap into their business analysis, valuation, and risk assessment. Then as you become more experienced, you can phase them out. |
1. Advanced Drainage SystemsAdvanced Drainage Systems, Inc. (NYSE: WMS) is the leading manufacturer of innovative water management solutions in the stormwater and onsite septic wastewater industries. WMS achieved 12.7 % CAGR growth in revenue over the past 9 years. But this was due to a combination of acquisitions and the past 2 years of high product prices. WMS serves mainly the construction sector which is not a high-growth one. This led to growing ROE and gross profitability. The growth in revenue and profitability is not sustainable in my view, due to cyclical crude oil prices. Next, growth was funded by a high Reinvestment rate as well as increasing debt. I also have concerns about its financial strengths. Furthermore, a valuation assuming that the high price situation would persist did not provide a margin of safety, and so this is not an investment opportunity in my view. For details, refer to my Nov 2023 Seeking Alpha article “Advanced Drainage Systems: Likely Not A Sustainable Performance” |
2. Alcoa
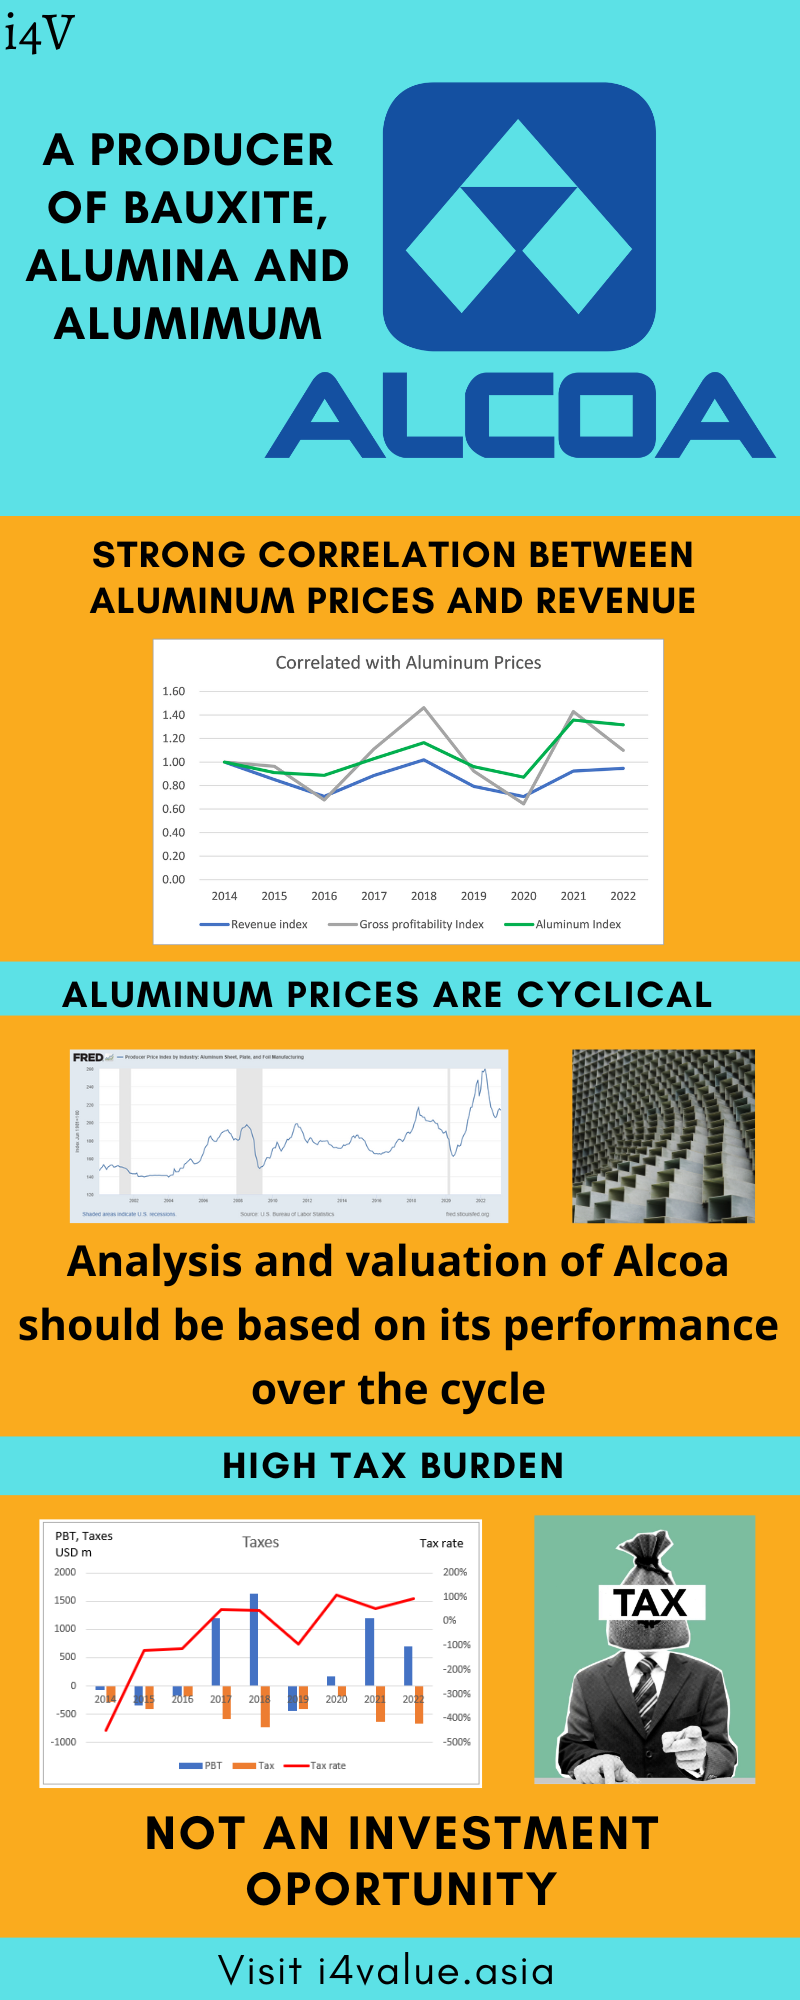
Alcoa is a producer of bauxite, alumina, and aluminum.
Aluminum prices are cyclical. Alcoa’s earnings would be cyclical given the strong correlation between aluminum prices and Alcoa's gross profitability.
Alcoa could generate significant operating profits under various aluminum price scenarios. However, over the past 9 years, Alcoa had a very heavy tax burden. There were taxes even if it was loss-making. During profitable years, tax rates ranged from 45 % to 108%.
There are two ways to explain the high tax rates.
Based on the tax reconciliation, the high tax rate is due to large changes in the valuation allowances.
Another explanation is that the high tax rate is due to arithmetic issues. The losses in the Domestic operations resulted in lower overall profits. The tax rate is then magnified.
To reduce the high effective tax rate, Alcoa needs to focus on changes in valuation allowances and make the Domestic operations profitable.
For details, refer to the following Seeking Alpha articles:
- May 2023 - “Alcoa: Taxes Are Killing The Value”
- Jun 2023 – “Alcoa: Exploring The Mystery Of High Tax Rates”
3. AptarGroup
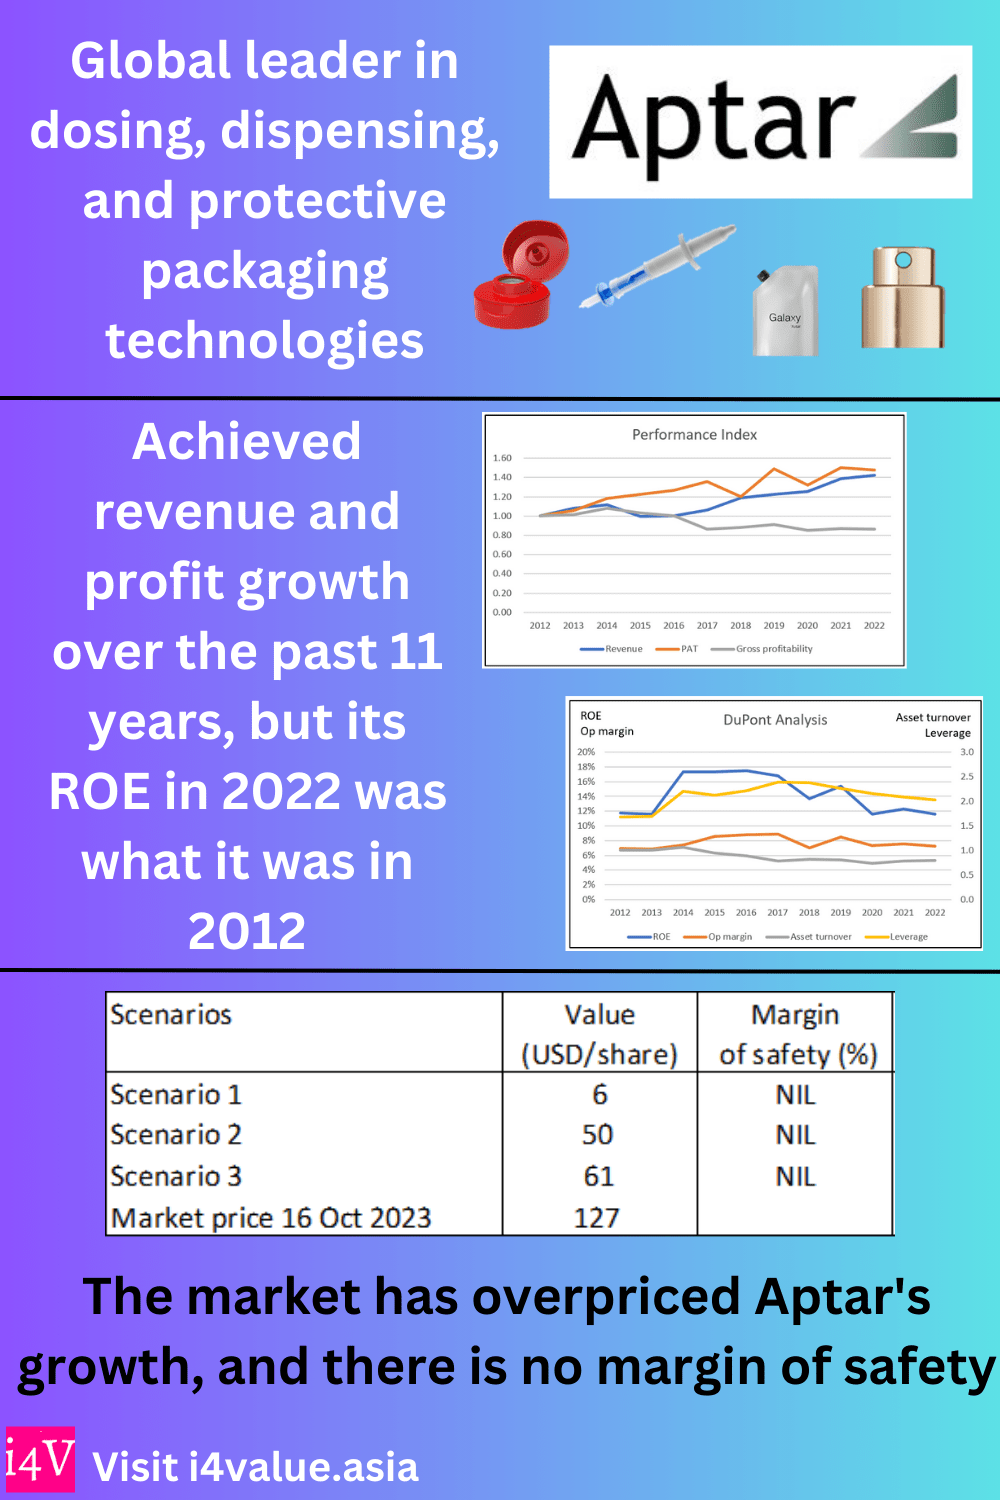
AptarGroup, Inc. (NYSE: ATR) has been able to grow its revenue and profits over the past 11 years at about 4% CAGR but its ROE in 2022 was what it was in 2012.
As profits grew there were disproportionate increases in total assets and capital funding the assets. This leads to deteriorating operating efficiencies. Its historical Reinvestment rate was also much higher than the fundamental rate.
Despite its financial strength and good capital allocation, the market has overpriced Aptar's growth, and there is no margin of safety at the current price.
For details, refer to my Oct 2023 Seeking Alpha article “AptarGroup: The Market Price Has Run Ahead Of Its Performance”
4. Arconic
Arconic was listed in 2020 following the split of its parent company into 2 public-listed companies. It comprised the rolled aluminum products, aluminum extrusions, and architectural products of the parent company.
During its 3 years as a public-listed company, Arconic had not been profitable. While revenue had grown by about 2/3 since then, it had incurred losses for the past 3 years. But this is a misleading picture as a significant part of the losses were due to one-off asset write-downs and restructuring charges. Without these, it would be profitable.
This is not a growth stock. There are also concerns about its financial strength and the strategic value of 2 of its business segments.
ARNC is a cyclical company. Despite its short history, its performance and valuation should be based on a cyclical lens. On such a basis and even assuming no further one-off charges, there is no margin of safety.
For details, refer to my May 2023 Seeking Alpha article “Arconic: Fundamental Issues Coupled With No Margin Of Safety”
5. Avery Dennison
Avery Dennison Corporation's (NYSE: AVY) is a global materials science and digital identification solutions company that provides branding and information labeling solutions.
Its revenue only grew at 4.4 % CAGR over the past 10 years. This is despite spending more on cash acquisitions than CAPEX. If nothing else, this suggests that it is in a mature sector. As such, productivity and efficiency improvements may be more important for growth.
Growth in PAT came from improving operating net margins rather than topline growth. ROE have also been on an uptrend driven partly by leverage. However, there were no improvements in other operating parameters such as gross profitability or asset turnover. But the company is fundamentally sound.
The market has fully priced in its current performance. My analysis shows that there is a potential for higher value. But there is no evidence that the company is delivering the required improvements.
For details, refer to my Oct 2023 Seeking Alpha article “Avery Dennison: Fundamentally Sound But Fully Priced”
6. BlueLinx
There is a strong correlation between BXC revenue and US Housing Starts. Housing Starts is cyclical and BXC should be analyzed and valued as a cyclical company.
While BXC's past 2 years’ performance has been record-breaking, it does not represent its performance over the cycle. The Housing Starts has started its downtrend and I would expect the revenue of BXC to follow suit. However, the market is not pricing BXC as a cyclical company.
The real valuation challenge is then what to use as the cyclical values. I have shown that if you use the historical averages, there is no margin of safety.
But if you ignore the cyclical picture and use some projected values, you can have a margin of safety. The real question is whether it is appropriate to use such projected values for cyclical companies.
I have mentioned about the limitations of my analysis. For example, a 20 % lower WACC could match the current market price. My point is that even with this, there is not enough margin of safety.
From a conservative perspective, I would not invest in BXC currently. In other words, it is not a good US stock. For details refer to the following Seeking Alpha articles:
7. Boise Cascade
Boise Cascade (BCC) is a US NYSE-listed company in the Lumber & Wood Production Industry that I classify as a good company.
Over the years, I have covered BCC several times. This is my updated investment thesis for BCC. Refer to
- Boise Cascade - The Risk Is In The Valuation - Mac 2022
Boise Cascade Company’s (NYSE:BCC) PAT in 2022 was about 7 times larger than that in 2013. But this growth was mostly driven by outlier product prices over the past 2 years. Product prices have declined since then.
The company is fundamentally sound with good returns, strong financials, and sustainable Reinvestment rates. But it is not a high-growth company and I have concerns about its operating efficiencies.
BCC is also a cyclical company. A valuation on such a basis taking into account the outlier price spike showed that there is no margin of safety.
8. Builders FirstSource (BLDR)
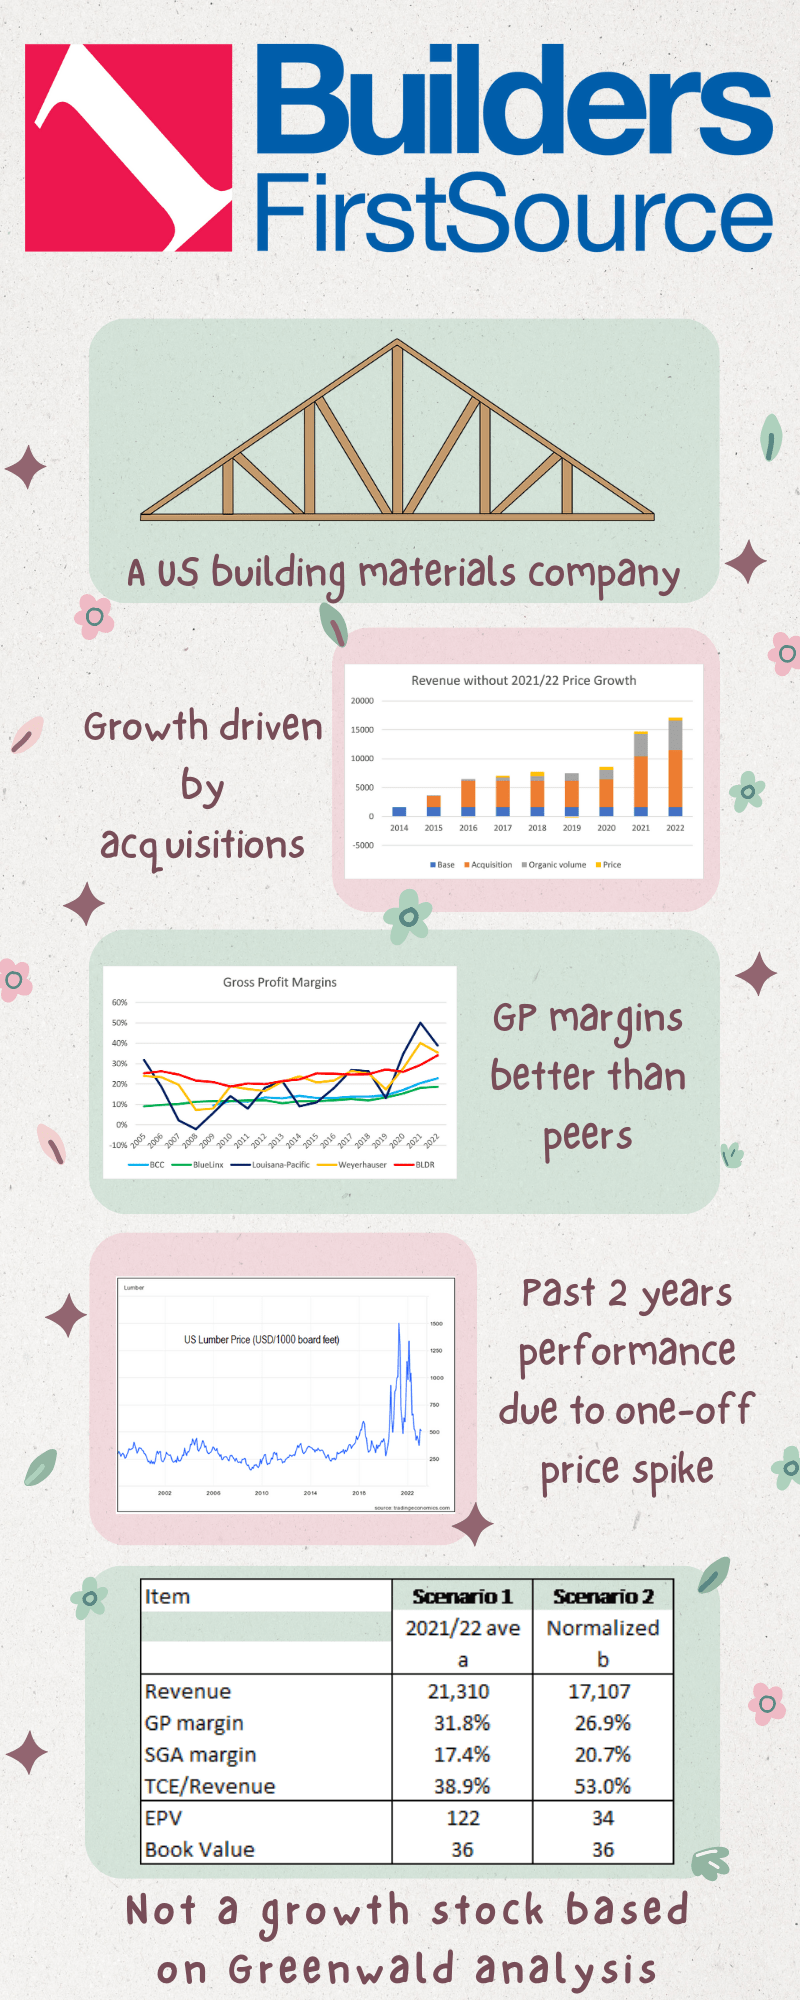
Builders FirstSource achieved tremendous double-digit growth over the past few years. But this was the result of acquisitions and one-off extraordinarily high product prices.
Its 2022 revenue is about 6.5 times larger than that in 2015. While revenue has grown, there are no clear improvements in the margins or asset utilization.
Its strong performance was in the past 2 years. These were due to the tailwinds from the one-off price spike. Washing out the effects of the price spike and looking at its performance over the cycle, it is not a high-growth stock.
While financially sound, BLDR’s performance is tied to the homebuilding sector, which is cyclical. As such, BLDR should be analyzed and valued as a cyclical company. On such a basis, there is no margin of safety at the current price.
A Greenwald analysis showed that is not a “franchise” with a moat. There is no margin of safety based on the Greenwald return formula.
Refer to the following Seeking Alpha articles:
9. Capstone Green Energy
CGRN is an ailing US microturbine manufacturer that has not been profitable since its IPO in 2000.
There are 2 challenges facing CGRN. It has to strengthen its Balance Sheet and turn the business into a profitable one. It would need additional funding to solve the first. But to do this, it has to convince investors and/or financial institutions that it can deliver the second.
But for CGRN to interest investors and/or other providers of Debt, it needs to show that the business is viable. This is not impossible as it has a products and distribution network. The market is growing and there is the possibility of extending its offerings to the air-bearing market.
The historical losses are because it is operating below the break-even levels. There is a growing market but it needs time to rebuild back its sale volume. The current market price is below its Reproduction Value.
All these are positive factors in seeking additional funding. It also makes CGRN an attractive acquisition target. But the funding has to be substantial.
There is value to the business. I estimated that at the current price, CGRN is fairly valued. I would go in if the price drops to USD 1. I do not consider this a good US stock.
For details, refer to my Oct 2022 Seeking Alpha article, "Capstone Green Energy: All Is Not Lost".
10. Carpenter Technologies
Carpenter Technology Corporation (NYSE: CRS) is engaged in the manufacturing, fabrication, and distribution of specialty metals. The company has 2 reportable segments - Specialty Alloys Operations and Performance Engineered Products.
Over the past 11 years, its revenue only grew at 1.2 % CAGR. Sales volume declined. Its earnings have been very volatile and I have concerns about its business fundamentals.
CRS is not a growth company.
The company has set a goal to double the 2019 operating profits by 2027. However, it did not have a track record of improving capital efficiency. Its unsustainable Reinvestment rate is contrary to its goal of better capital spending discipline. I also have concerns about its financial standing.
This is a cyclical company and a valuation based on such a lens showed that there is no margin of safety.
For details, refer to my Nov 2023 Seeking Alpha article, “Carpenter Technology: Volatile Earnings Resulting In Poor Cyclical Performance”
11. Century Aluminum
Century Aluminum (CENX) is a global producer of primary aluminum. It operates 3 aluminum smelters in the United States and one in Iceland.
CENX revenue grew faster than the demand for aluminum. Together with a 2 PBV multiple, you could think that this is a growth stock. But it is not.
Revenue growth was partly due to the 2021/22 spike in commodity prices. But this is a sector with cyclical prices. The long-term aluminum price growth is only 1 % CAGR.
PAT had not grown over the past 12 years. Gross profit margins were volatile without discernible growth trends. Production had to be curtailed.
There are no fundamental reasons to support a growth picture. Also, a Greenwald Asset Value vs EPV analysis show that this is not a growth stock.
For details, refer to the following Seeking Alpha articles:
- Apr 2023 - Century Aluminum Is Not A Growth Stock
- Jan 2024 - Century Aluminum: A 7-Foot Bar To Jump Over
12. Constellium
Constellium CSTM is a global leader in the development, manufacture, and sale of highly engineered, value-added specialty rolled and extruded aluminum products. The company has 3 major business segments with major operations and markets in Europe and North America.
Constellium IPOed in 2013. It had a challenging performance during the first few years. But the past few years' results seem to suggest that it has turned around.
Constellium's 6.8% CAGR in revenue over the past 10 years hides the low shipment growth. Its growth in selling price was also very much lower than that of aluminum.
CSTM is a cyclical company, and any analysis and valuation should be based on its performance over the cycle.
On such a basis, there is no margin of safety. I also have concerns about its profitability and financial strength. As such, this is not an investment opportunity.
For details, refer to my May 2023 Seeking Alpha article “Constellium: Fundamental Issues Coupled With No Margin Of Safety”
13. Core Molding Technologies
Over the past decade, Core Molding Technologies’s revenue and earnings more than doubled. However, this growth rate is not sustainable. There was no significant improvement in operating efficiencies over the past decade. But it is financially strong so there is a performance gap.
CMT is a cyclical company. While the average thermoplastic price over the past 3 years was about 1/3 higher than the average 2014 to 2016 price, current prices seem to have come down to the 2014 level. It also has a significant reliance on its top 5 customers, although this risk has been decreasing over time.
A valuation based on its performance over the cycle did not show any margin of safety. Its performance gap and poor margin of safety meant that this is not an investment opportunity.
For details, refer to my Feb 2024 Seeking Alpha article “Core Molding Technologies: Outlier Product Prices Painted A Misleading Performance”
14. Cummins
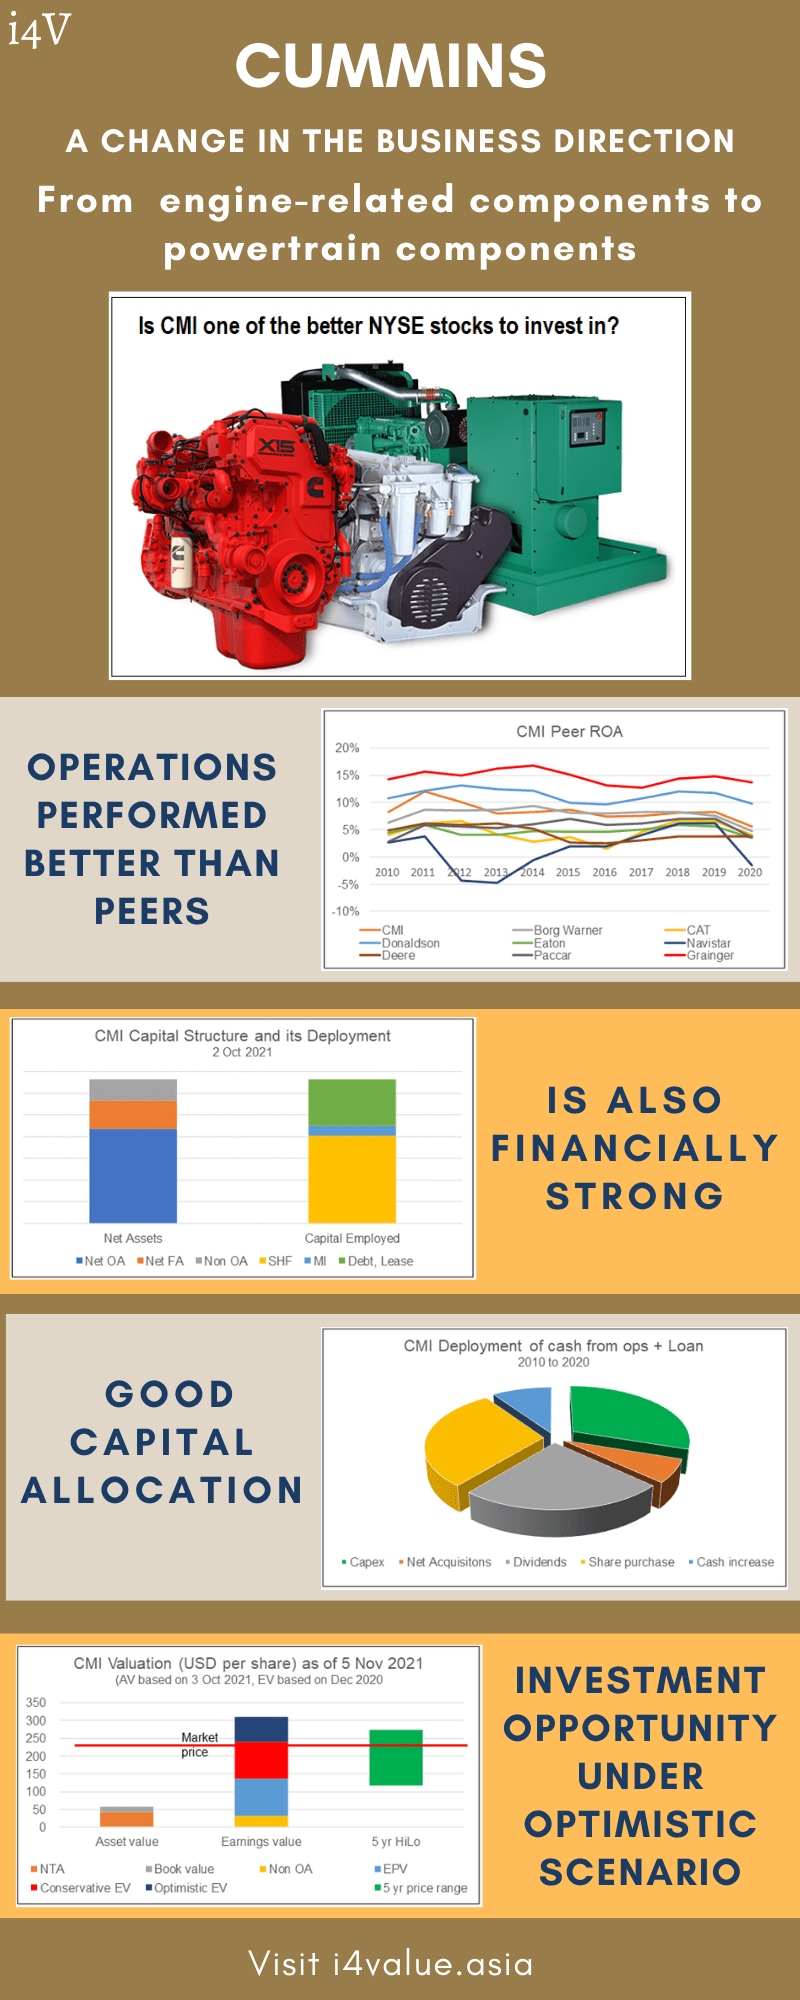
Cummins (CMI) designs, manufactures, distributes and services a wide range of engine-related products worldwide. These included diesel, natural gas, electric and hybrid powertrains and, powertrain-related components.
CMI is fundamentally strong.
- It has a very low net Debt-Equity ratio.
- It has achieved an average 23 % ROE from 2010 to 2020.
- It has been able to achieve a revenue CAGR of 4.1 % from 2010 to 2020.
- The Group had changed its business direction to take into account the market trends.
- Management is both a good operator as well as a capital allocator.
- The Group has a track record of creating shareholders value.
CMI has a good margin of safety. This comes from assuming that it can deliver high growth rates over the next 10 years. These are single digits growth rates just a few % points above the US long-term GDP growth rates. The numbers are not some mind-boggling growth rates.
I would conclude that there is an investment opportunity here and that CMI is one of the better NYSE stocks to invest in. It is a good US stock.
15. D.R. Horton (DHI)
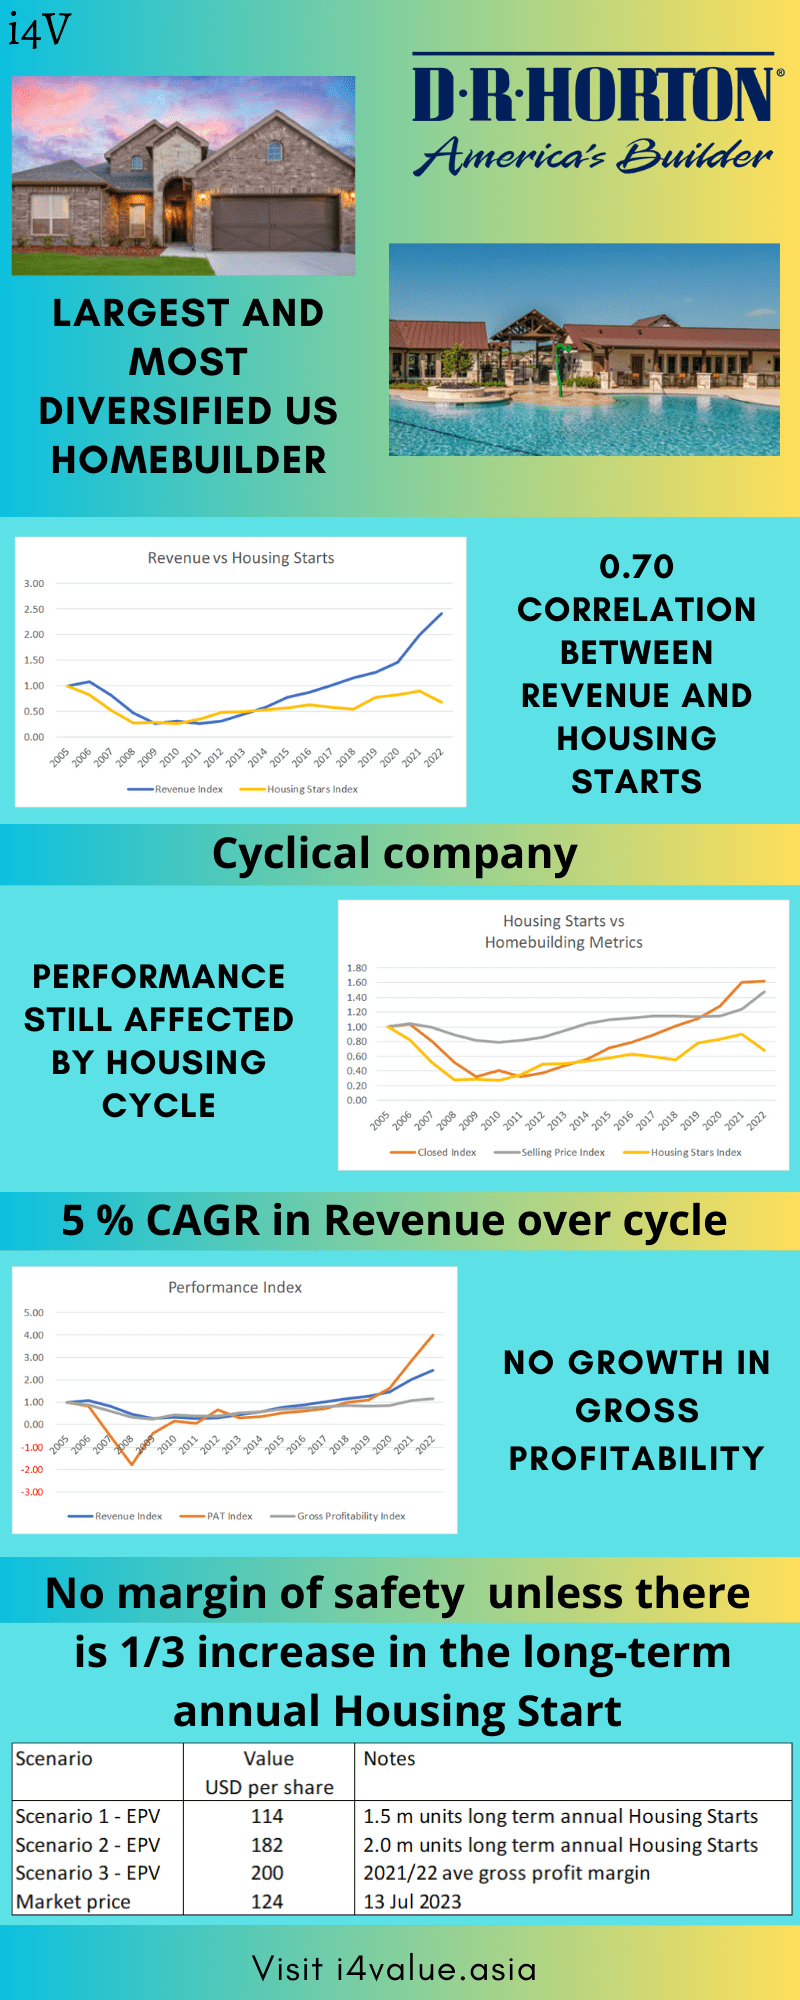
DHI has been the largest homebuilder by volume in the United States since 2002 and has closed more than 1,000,000 homes in its 45-year history.
Despite its size and geographic spread, DHI had not been able to improve its gross profitability over the cycle. I would also rate its financial position as average.
From 2005 to 2022, its revenue grew at a CAGR of 5 %. During this period there was a strong correlation between its revenue and Housing Starts.
Housing Starts are cyclical. But over the past 70 years, there was no growth in the long-term annual average Housing Starts. As such, you should view DHI as a cyclical company, but with a small growth path.
I assumed that the cycle performance is represented by the 2005 to 2022 performance. This is pegging it to the latest peak-to-peak Housing Starts cycle.
My valuation of DHI on such a basis showed that I could not get a 30 % margin of safety even with various ways to calculate the gross profit margins. This is based on the view that there is no growth in the long-term annual average Housing Starts.
Even if I assumed that there is a 1/3 increase in the long-term annual average Housing Starts, the margin of safety is still lower than my 30% cut-off.
For details refer to my July 2023 Seeking Alpha article “D.R. Horton: Still A Cyclical Company Despite Its Size And Geographical Spread"
16. eXp World Holdings
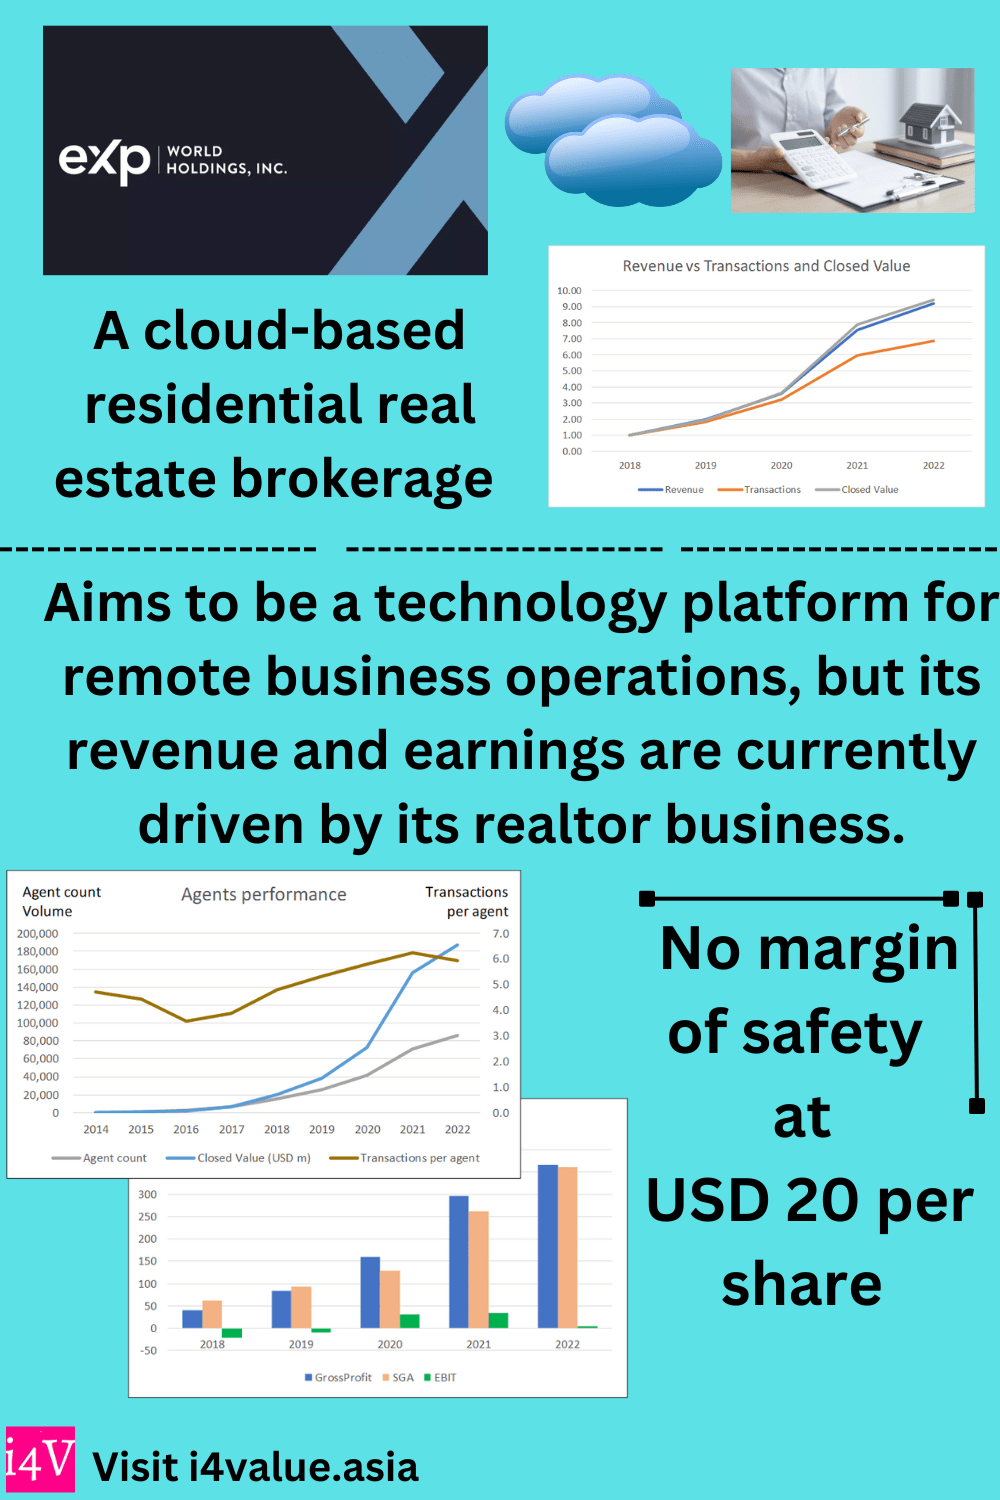
EXPI was listed on Nasdaq in 2018 as a cloud-based residential real estate brokerage serving North America. Since then, the company has entered the international real estate brokerage business. It has also positioned itself as a technology platform that enables businesses to operate remotely.Not only has EXPI increased the number of agents, but it also managed to improve the number of transactions per agent. This lead to increased revenue that translated to increased EBIT.
The company of course ascribe the revenue and earnings growth to its technology platform. The platform enables it to lower its operating costs and provide a better share of the commissions to the agents. It has also touted its training and coaching programs.
Despite the hype about its technology platform, the current performance of EXPI suggests that:
- It is more of a realty brokerage that is leveraging technology, than
- A technology platform making money from fees from an expanding network of users.
The valuation of the realtor business does not provide a margin of safety, and the value of the technology platform is uncertain.
Refer to my 25 August 2023 Seeking Alpha article “eXp World Holdings: More Of A Realtor Leveraging On Tech Than A Tech Platform Business”
17. Generac
Power generation and storage are the key focus of the Group. Its success is built on its engineering expertise, manufacturing excellence, and innovative approaches.
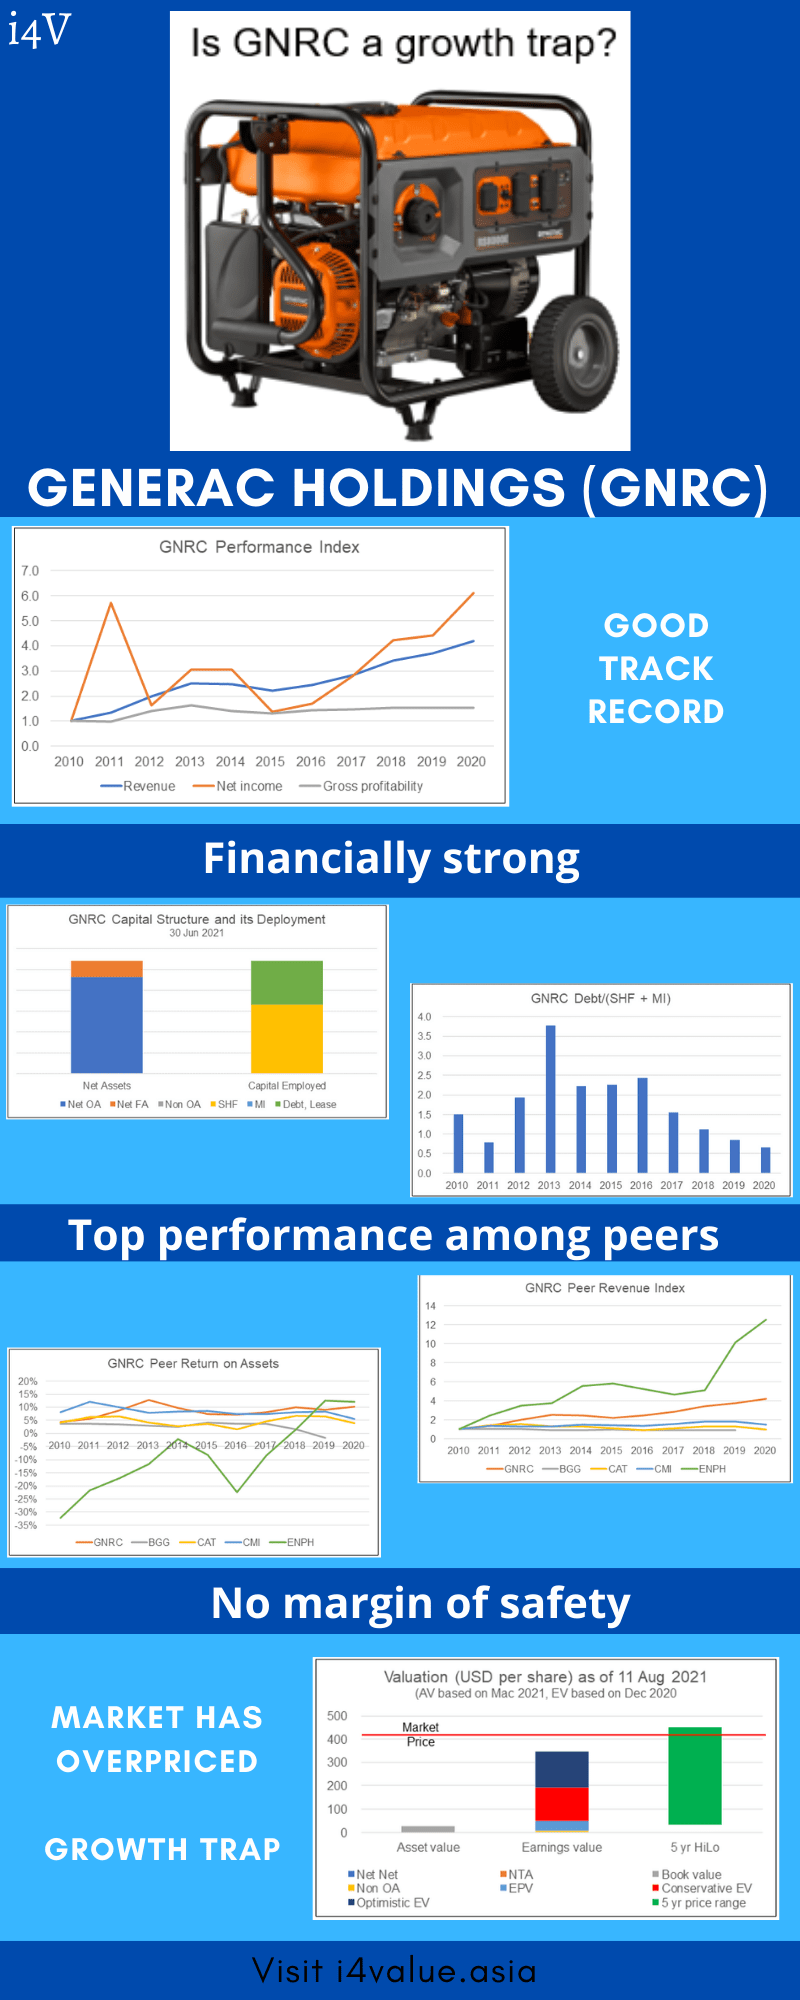
The analysis showed that GNRC is fundamentally strong.
- It is financially healthy with a 0.6 Debt Equity ratio as of Jun 2021. The Group had been able to increase its ROE from 13 % in 2010 to 24 % in 2020.
- It achieved a 15.4 % CAGR in revenue from 2010 to 2020. About 1/3 of this has been from organic growth. The Group has been able to fund its growth from internally generated funds.
- The generator industry is not a sunset one. There are still prospects for growth. But the bigger growth will be from the international market where GNRC has a small presence.
- Management has a good track record for operations and capital allocation.
- It has been able to create shareholders’ value.
- The main risk - new acquisitions - seemed manageable.
Unfortunately, the current market price does not provide any margin of safety. The market is pricing GNRC at a growth rate that is not realistic. I would conclude that GNRC is a growth trap. It does not look like a good US stock to invest in.
I have also written about this company in Seeking Alpha. Refer to:
18. Graphic Packaging
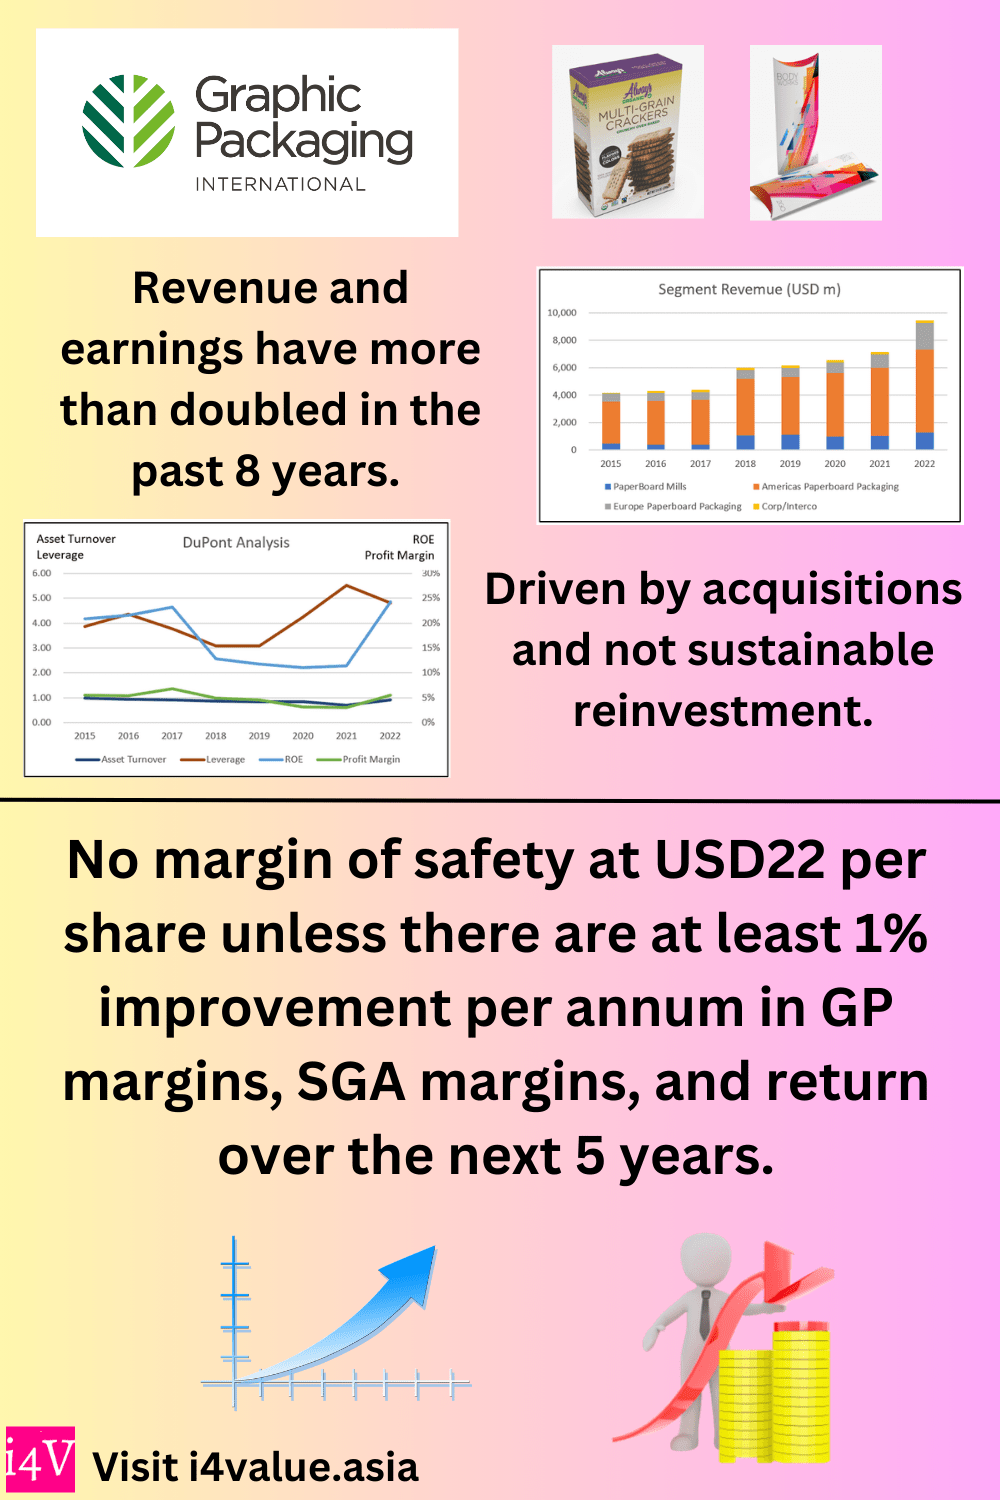
Graphic Packaging (GPK) is a leading provider of sustainable fiber-based packaging solutions to the F&B, and other consumer products companies. It has 3 reportable business segments.
While GPK had achieved revenue and profit growths over the past 8 years, these were driven by acquisitions rather than efficiency or productivity improvements.
There are limits to this growth by acquisitions. Firstly, the Reinvestments to drive growth are at an unsustainable Reinvestment rate. Secondly, it has resulted in high leverage.
The packaging sector is not a high-growth one. I think the company is nearing a stage where the tough part of Vision 2025 - productivity-driven margin improvement – has a central role. But there is no trend of such efficiency and productivity improvements over the past 8 years.
My analysis and valuation showed that there is only a margin of safety if there are efficiency and productivity improvements. Revenue growth alone is not sufficient.
You can understand why I do not consider GPK stock an investment opportunity as I have yet to see a track record of productivity-driven margin improvements.
For details refer to my 7 Sep 2023 article on Seeking Alpha “Graphic Packaging: Yet To Deliver The Productivity-Driven Margin Improvement Of Vision 2025”
19. Innovative Industrial Properties
Innovative Industrial Properties (IIPR) is the first publicly traded company on the New York Stock Exchange to provide real estate capital to the regulated cannabis industry.
This is an investment where I cautioned about going in currently based on the following:
- IIPR had grown its lettable area and AFFO per share 6 to 7 folds since its IPO in 2016.
- While the company has grown significantly, this was driven by its financing strategy rather than operating or marketing strategies.
- Its property acquisitions were funded by equity that benefited from increasing share prices. AFFO per share growth was due to the rents increasing at a faster rate than the number of shares.
- The current economic situation is different. It will be more challenging to fund its acquisition via equity given the lower share price. The lower share price also meant more shares issuance which will affect the AFFO per share.
- Given the high-interest rate, the decline in IIPR share price, and the potential recession, this model is no longer tenable. IIPR would find it challenging to grow its lettable areas as well as grow its AFFO per share.
- Looking at IIPR through a no-growth lens, there is no margin of safety at the current market price
You can understand why I don’t consider this company a good US stock. For details refer to:
- Innovative Industrial Properties: Growth Will Likely Be More Challenging – Seeking Alpha, Aug 2022.
20. Installed Building Products
Installed Building Products (IBP) IPOed in 2014 as the second largest new residential insulation installer in the US.
Over the past 9 years, IBP benefited from the growth in total construction spending. There was a multiplier effect as IBP also had an acquisition program that benefited from the growth in construction spending.
The company used the construction spending tailwinds to grow its revenue and profits manyfold.
But profit growth was driven more by improvements in margins rather than improvements in capital efficiency. But further margins improvement will be difficult when revenue growth declines.
The total construction spending is cyclical and the company has positioned itself to mitigate the cyclical impact.
But its growth was driven by an unstainable Reinvestment rate. This meant that growth will have to slow down. I expect a reduction in acquisitions. But this is manageable as most of the acquisitions are small-sized ones.
Historically, acquisitions accounted for a larger part of the growth. When there is a reduction in acquisitions, I would expect growth to slow down a lot.
The issue is its current stock price. Based on an optimistic valuation model and assuming a slowdown in growth, there is no margin of safety.
For details, refer to my 18 Aug 2023 Seeking Alpha article “Installed Building Products: Not A Sustainable Reinvestment Rate”
21. Kaiser Aluminum
Kaiser Aluminum (KALU) serves the cyclical aluminum sector. But it tries to negate the cyclical impact with its “metal price neutral” approach using Conversion Revenue as the key top-line metric.
There is a 0.85 correlation between Conversion Revenue and aluminum prices making KALU a cyclical company. Any analysis and valuation should be based on its performance over the cycle.
However, only the GE product is cyclical. To value KALU, I had to consider the various products that perform differently. I used a sum-of-parts approach to consolidate them.
On such a part cyclical lens, there is not enough margin of safety. There is only a margin of safety if you ignore the evidence that it is a part cyclical company.
For details, refer to my May 2023 Seeking Alpha article “Kaiser Aluminum: The Metal Price Neutral Approach Is Not Working Fully”
22. KB Home (KBH)
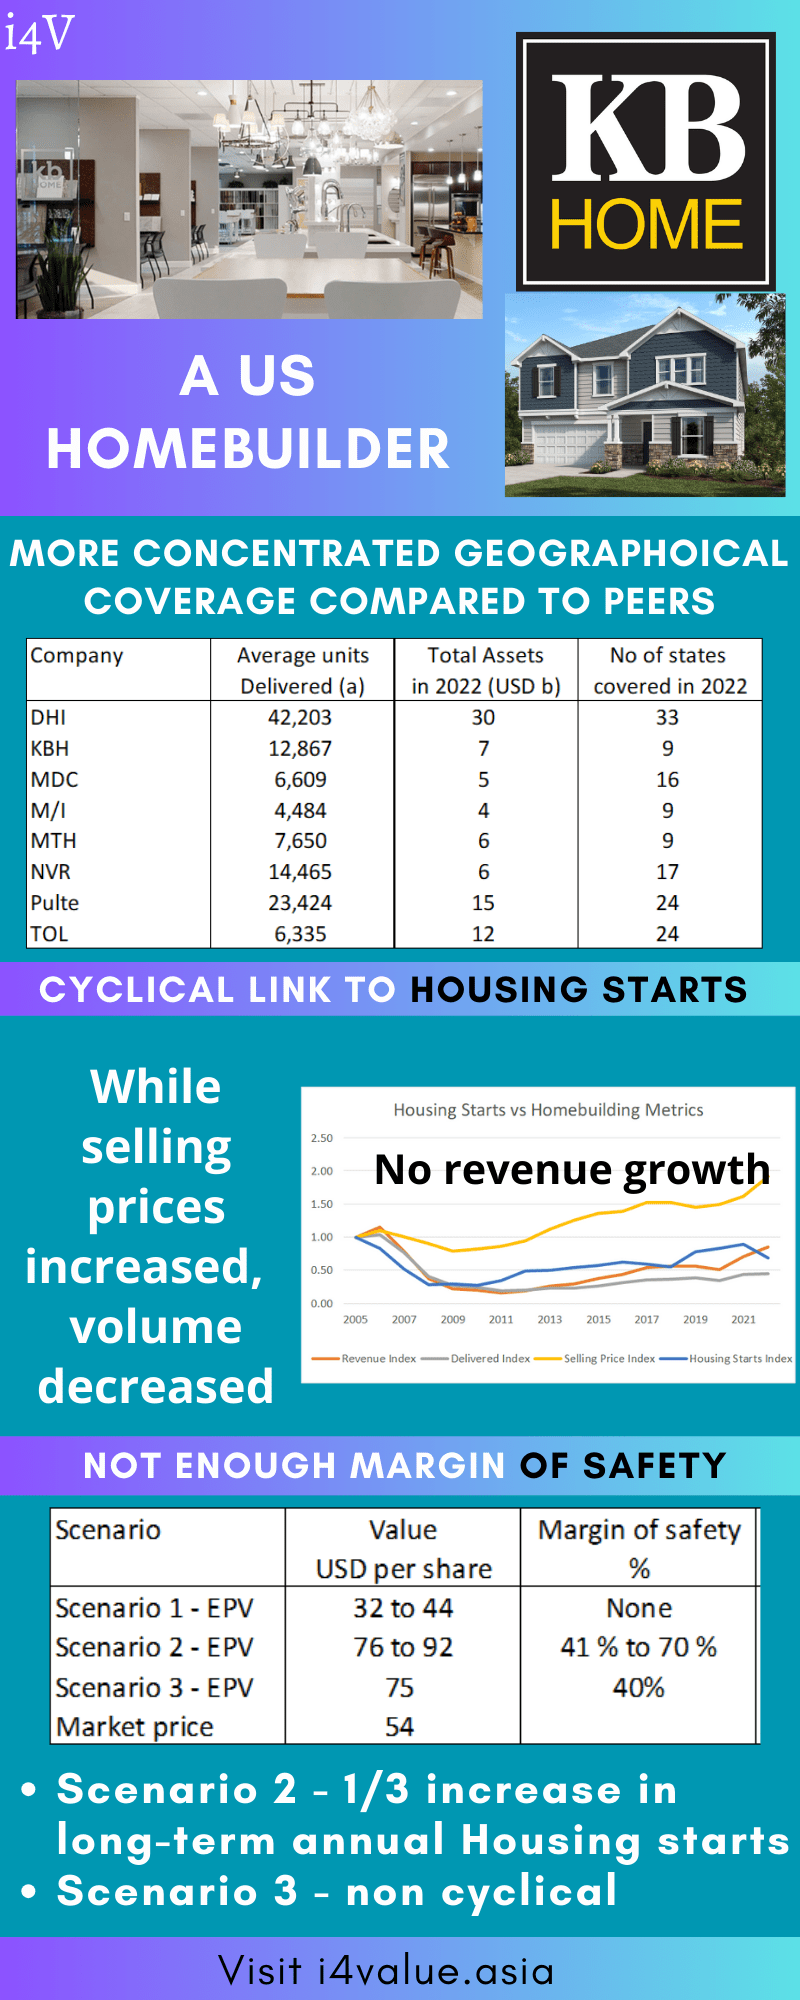
KBH is a mid-sized US homebuilder with a concentrated geographical coverage. Its homebuilding operations span only 9 states.
KBH has not achieved any revenue growth over the past 18 years and has poor financial position and low returns.
- Its revenue shrank from 2005 to 2022.
- It incurred losses from 2007 to 2012.
- It did poorly on 2 of the financial metrics – cash on hand and Debt Equity ratio.
- It has not been able to achieve a return over the cycle that is greater than the cost of funds.
- It has not been able to deliver the asset efficiency part of its KB Edge strategy. There was no improvement in gross profitability and asset turnover.
KB Home is a cyclical company with a strong correlation between its revenue and housing starts. Any analysis, and valuation of KBH should be based on its performance over the cycle.
I assumed that the cycle is represented by the 2005 to 2022 performance. This is pegging it to the latest peak-to-peak Housing Starts cycle.
The EPV of KBH on such a basis showed that there is no margin of safety under all the 3 Scenarios. I would not invest in KBH from both the margin of safety and business fundamentals perspective.
For details refer to my Aug 2023 Seeking Alpha article “KB Home: Revenue Shrank Over The Cycle"
23. Leggett & Platt
LEG is a pioneer in sleep technology. Today the Group conceives, designs, and produces a diverse array of products that can be found in most homes, offices, and vehicles.
By analyzing LEG as comprising a Special Foam division and a Classic LEG division, you can see the growth potential for LEG.
- The Classic LEG division is a “steady” business with revenue growing at a CAGR of 2.2 % from 2010 to 2019.
- The Specialty Foam division is in a growth sector with double-digit revenue growth in 2019.
LEG management has extolled the Specialty Foam contribution to LEG's bedding business. The question is whether it will be able to transform the Group into a growth stock. For this to happen, the following must occur:
- The Specialty Foam division growth must result in double-digit growth for the Group.
- The intrinsic value of the Group must far exceed the current market price.
The revenue growth for the Group in the first quarter of 2021 barely touched 10%. The Group has not reported whether this growth was driven by the Specialty Foam division. At the same time, there is no conclusive evidence that the Group can sustain an overall growth rate of more than 10 % for several years.
There is currently no margin of safety even if you viewed the Specialty Foam Division as a growth segment. At the current price, LEG is a growth trap. Why would you consider this company a good US stock?
I have also written about LEG for Seeking Alpha. Refer to:
24. Lennar
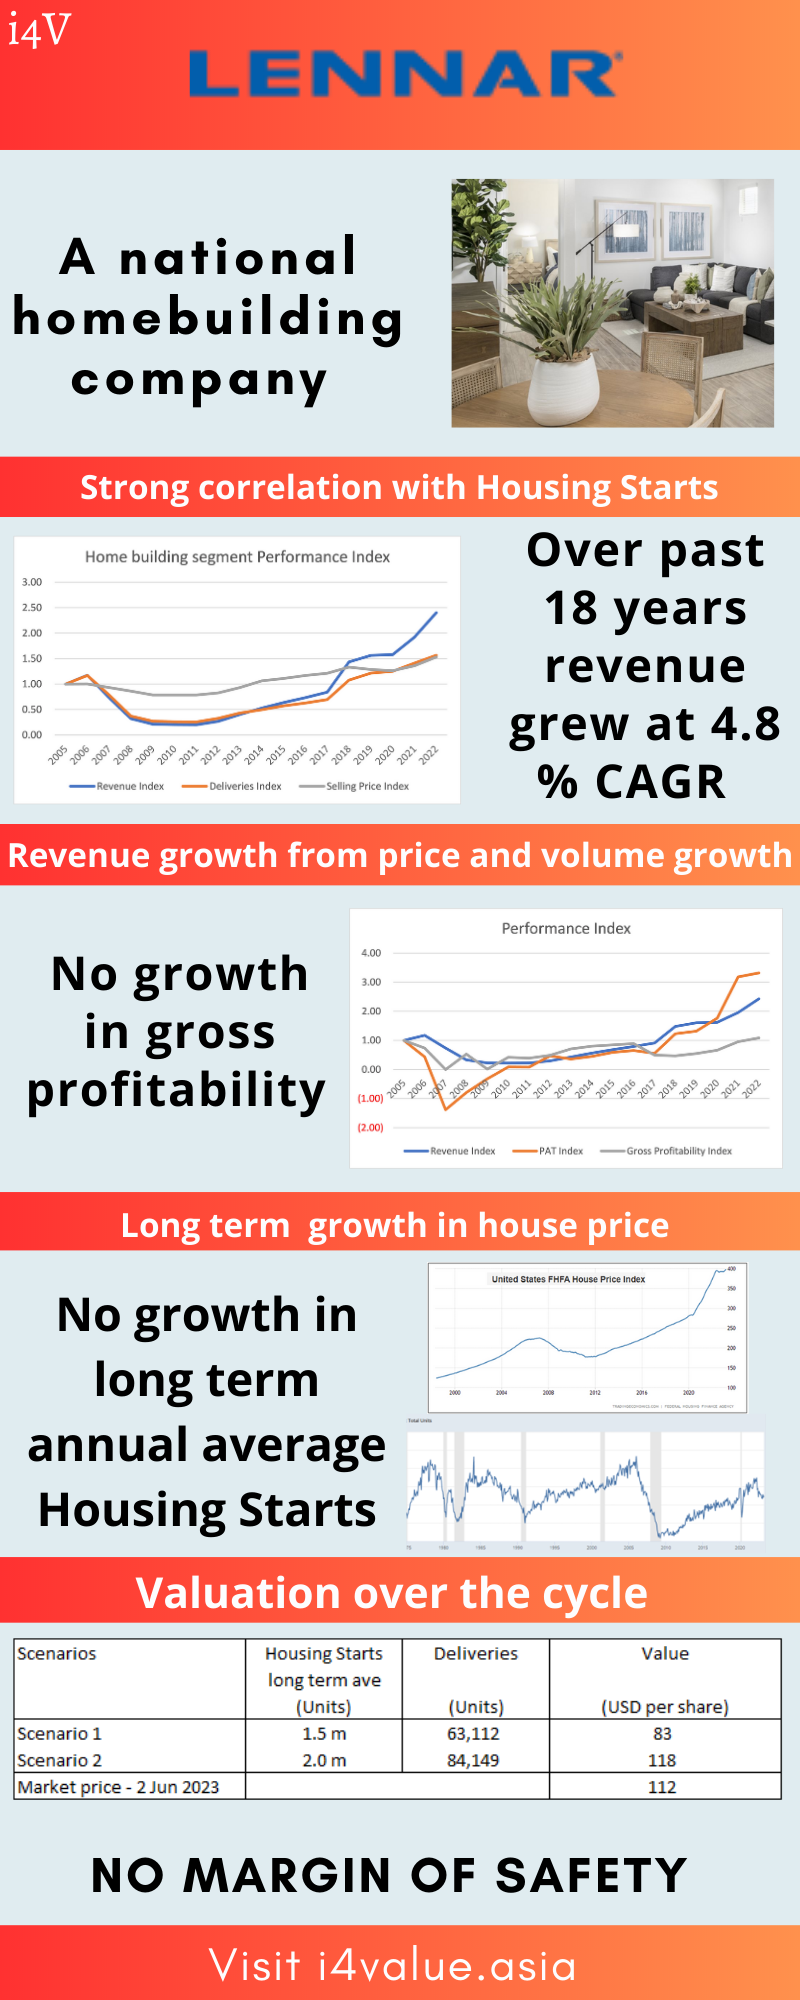
The homebuilding sector is cyclical. There is a 0.6 correlation between the US Housing Starts and LEN's revenue.
Any valuation of LEN should be based on its cyclical performance, adjusted by the impairment. But the size of the impairment would depend on the duration and depth of the downtrend.
The challenge is in determining LEN’s cyclical value. This is because Lennar is a different entity today compared to the pre-2017 periods due to the acquisitions. At the same time, there is uncertainty about the duration and the peak-to-trough values of the cycle.
To overcome these issues, I had covered Lennar twice over the past few years. The general conclusion remains the same.
Taking all these into consideration, there is no margin of safety. For details refer to my Seeking Alpha articles:
Martin Marietta Materials Inc has managed to grow its revenue at a faster pace than total construction spending over the past 17 years. This was via a combination of acquisitions and changes in the product mix.
MLM serves a low-growth cyclical construction sector. The growths and changes did not translate into positive trends for all the metrics that drove returns. ROE declined. Gross profitability also declined. Capital efficiency got worse.
A Greenwald "Asset Value vs. EPV" analysis indicates that this is not a "franchise”. This is not a growth stock. The appropriate valuation metric is EPV. On such a basis there is no margin of safety at the current price.
Refer to the Feb 2023 Seeking Alpha article “Martin Marietta Materials: Revenue Growth Hides The Real Picture”
26. Masonite (DOOR)
Masonite International Corporation (NYSE: DOOR) is a cyclical company. Its recent good performance was due to being in the uptrend leg of the cycle. There is a strong correlation between DOOR revenue and the US Housing Starts. As such I would peg DOOR's cyclical performance to that of Housing Starts.
There is also a strong correlation between revenue, gross profit margins, and gross profitability. When revenue declines so will these margins and returns. At the same time, SGA appears “sticky”.
While it delivered a 30 % ROE for FYE Jan 2023, its long-term performance and value should be viewed through a cyclical lens.
Based on the cyclical lens, there is no margin of safety at the current market price. The market is pricing DOOR as if it can continue to grow revenue and improve its margins.
For details, refer to my Mac 2023 Seeking Alpha article “Masonite International: The Market Is Not Pricing This As A Cyclical Company”
27. M.D.C. Holdings (MDC)
I first covered MDC is Jan 2022 where I concluded that there was not margin of safety. This is an updated analysis of MDC.
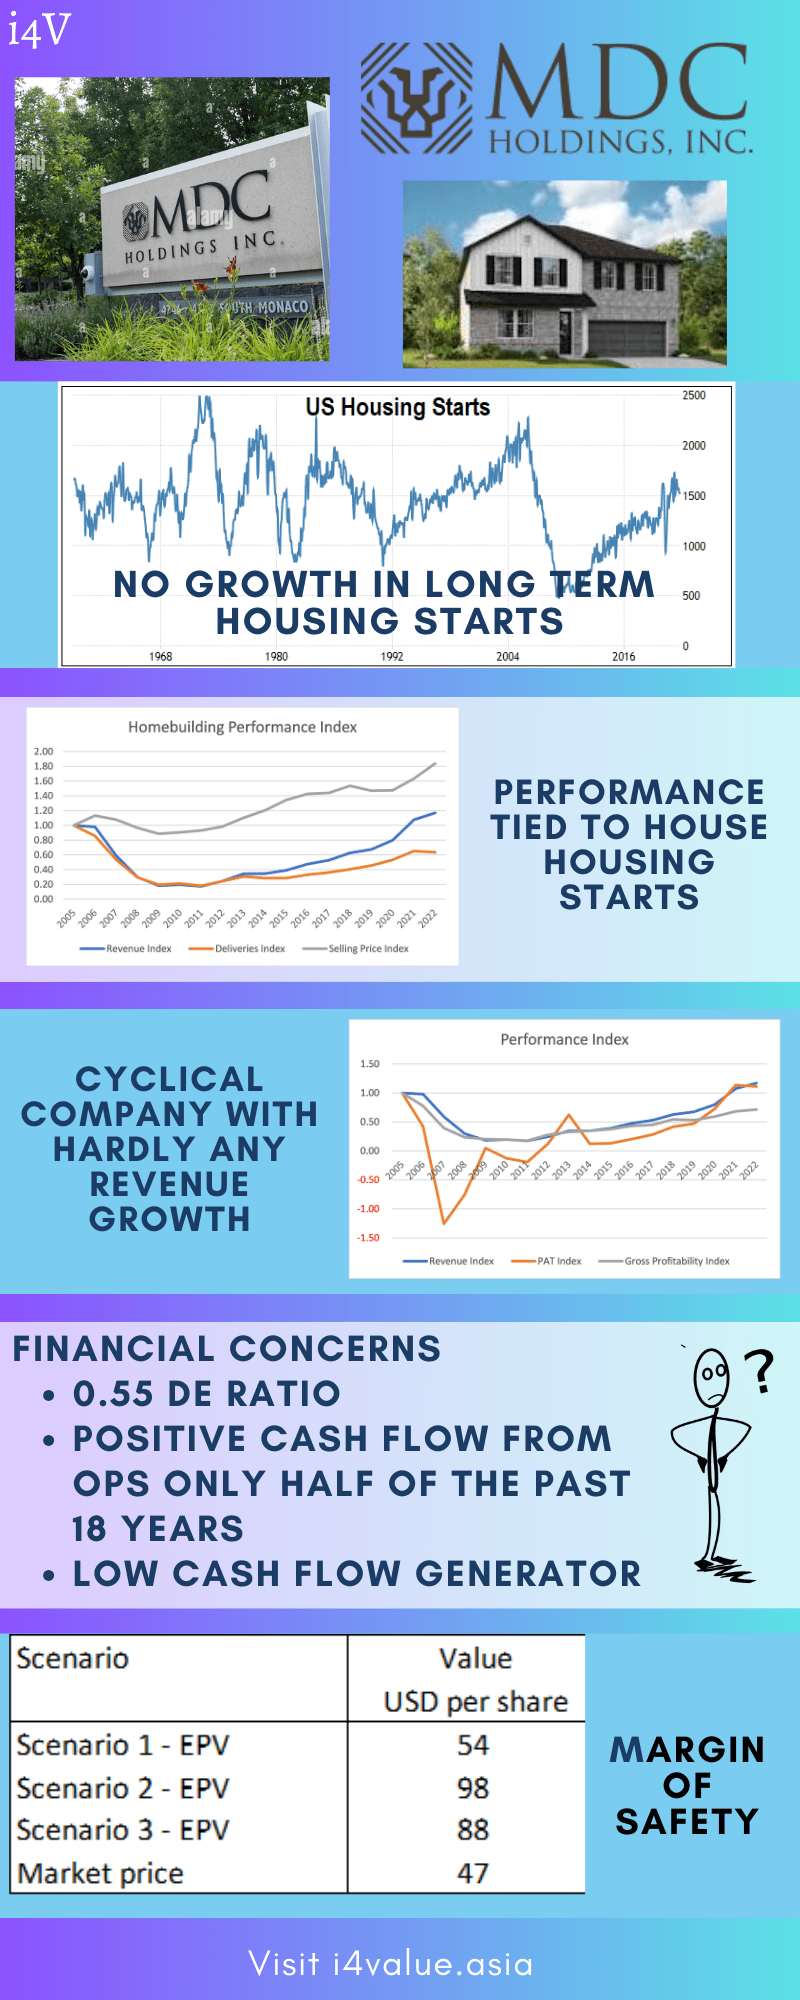
MDC is no-growth company in a no-growth cyclical sector.
- MDC had hardly any revenue growth over the past 18 years and should be valued based on its cyclical Earnings Power Value.
- MDC is a cyclical company as its performance is tied to US Housing Starts, where there was no growth in the long-term annual average over the past 70 years.
Any analysis, and valuation of MDC should be based on its EPV over the cycle.
I assumed that the cycle is represented by the 2005 to 2022 performance. This is pegging it to the latest peak-to-peak Housing Starts cycle.
My valuation of MDC on an EPV basis and over the cycle showed that there is a 16% to 41 % margin of safety depending on how you calculate the gross profit margins. This is based on the view that there is no growth in the long-term annual average Housing Starts.
If you assumed that there is a 1/3 increase in the long-term annual average Housing Starts, the margin of safety would be greater than my 30% cut-off.
For details, refer to:
- MDC Holdings Is A Cigar-Butt Opportunity – Seeking Alpha, Mac 2022.
- M.D.C. Holdings: Not The Best Financially But Has A Margin Of Safety – Seeking Alpha, July 2023
28. Meritage Homes
I first covered Meritage Homes (MTH) in Nov 2022 and concluded that there was likely no margin of safety even though the current market price at USD 84 per share was below the Asset Value.
I was also worried about this company being a good US stock. The positive point was that MTH is financially sound and would probably be able to withstand the impact of a downtrend.
In this update, I maintained that it is a cyclical company with average fundamentals.
- Its revenue from 2005 to 2022 was strongly correlated with Housing Starts. Any analysis, and valuation of MTH should be based on its performance over the cycle.
- I would rate MTH's performance and financial position as average. It had not been able to improve its gross profitability over the cycle.
I assumed that the cycle is represented by the 2005 to 2022 performance. This is pegging it to the latest peak-to-peak Housing Starts cycle.
My valuation of MTH on such a basis showed that I could not get a 30 % margin of safety even with various ways to calculate the gross profit margins. This is based on the view that there is no growth in the long-term annual average Housing Starts.
But if you assumed that there is a 1/3 increase in the long-term annual average Housing, there would be more than a 30% margin of safety. I do not view this as realistic.
For details, refer to my Seeking Alpha articles:
29. M/I Home (M/I)
M/I is a small-sized US homebuilder operating in 9 states.
From 2005 to 2022, there was a 0.71 correlation between the homes delivered by M/I and Housing Starts. Housing Starts are cyclical making M/I a cyclical company.
In 2022, M/I was a much bigger company compared to that in 2005. Its 2022 revenue was 3 times bigger while its Net Income was almost 5 times larger. Unfortunately, its capital efficiency as measured by the gross profitability did not improve. I would also rate M/I's financial position as poor.
About 1/3 of its revenue growth was driven by growth in house prices. As such, I valued M/I as a cyclical company, but with a growth path capped at the US long-term GDP growth rate of 5%.
A valuation of M/I on such a basis with different gross profit margin assumptions showed that there is not enough margin of safety even under the most optimistic scenario.
For details refer to my July 2023 Seeking Alpha article “M/I Homes: No Margin Of Safety Even With Optimistic Scenarios”
30. Mueller Industries
Mueller Industries achieved extraordinary profit growth over the past 8 years. Accordingly, its average returns as measured by the ROE over the past 3 years were more than double the 2016 to 2018 average ROE.
But these growths were driven by extraordinary copper and aluminum prices over the past 3 years. Ignoring these price growths, there was no organic growth. Growth seemed to be from its acquisitions. Growth seemed to be from its acquisitions. The overall impact is that revenue only grew at 7.5% CAGR. This is not a high-growth company but a cyclical one.
While I would not rate its operations as wonderful, it is a cash cow and financially strong. However, there is no margin of safety based on its performance over both the Housing Starts and product price cycle.
For more details refer to my Feb 2024 Seeking Alpha article “Mueller Industries Benefited From Extraordinary Product Price Spikes, But These Are Coming Down And So Will Its Performance”
31. NVR
I first covered NVR in 2022 and found that the market price of NVR had declined to USD 3,951 per share as of 28 Jun 2022. Despite the decline in the share price, there is still a good margin of safety. As such I would consider NVR as one of the better NYSE stocks to invest in. In other words, it is a good US stock.
This is an update of NVR.
I would rate NVR as financially sound, with strong performance over the past cycle - 2005 to 2022 (peak-to-peak).
But I would not consider it a high-growth one. NVR is a low-growth cyclical company as its performance is tied to US Housing Starts where there was no growth in the long-term annual average over the past 70 years.
Given this and that it is a cyclical company, any analysis, and valuation of NVR should be based on its performance over the cycle.
I assumed that the cycle is represented by the 2005 to 2022 performance. This is pegging it to the latest peak-to-peak Housing Starts cycle.
My valuation of NVR over the cycle showed that there is no margin of safety. The crux of my valuation is that there is no long-term annual average Housing Starts growth.
Even if you assumed that there is a 1/3 increase in the long-term annual average Housing Starts, my analysis showed that there is only a 12% margin of safety if I assumed that it would take 5 years to reach this increased level. This is not sufficient as my target is a 30% margin of safety.
There is also not enough margin of safety if you assumed that NVR is a non-cyclical company and that the past 2 years’ performance represented its future.
For details, refer to the following:
- NVR: A Good Jockey On A Strong Horse Riding Into A High Inflation Environment – Seeking Alpha, Apr 2022.
- NVR: Lots Of Cash But No Margin Of Safety – Seeking Alpha, July 2023
32. Olympic Steel (Zeus)
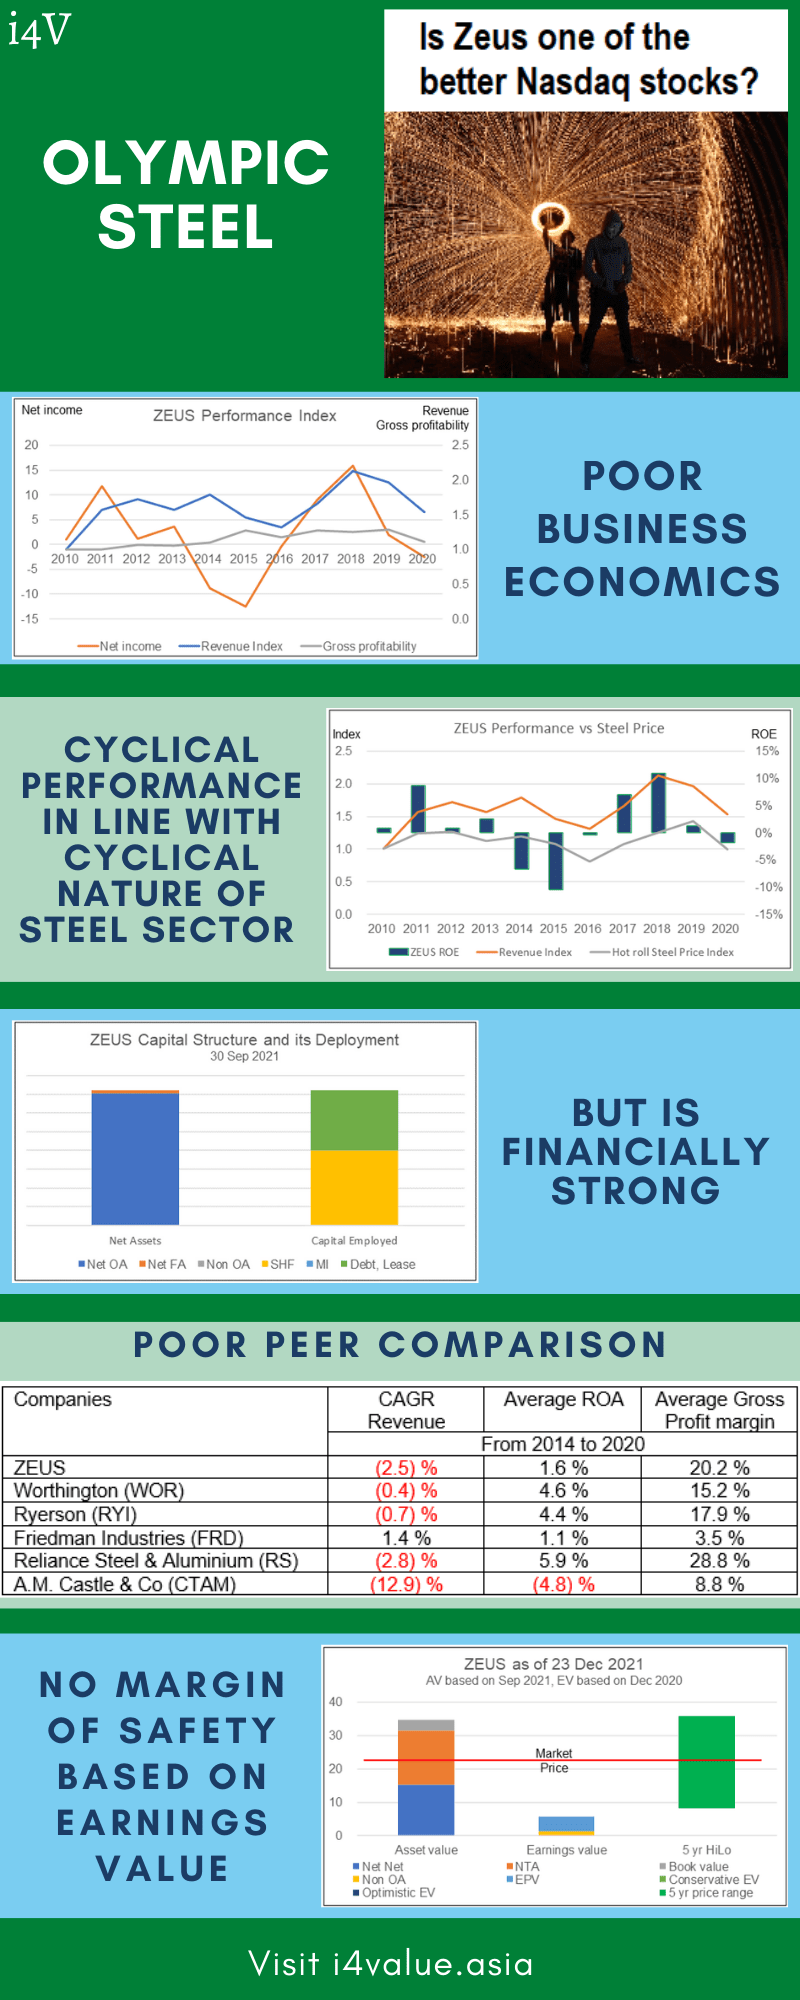
Zeus is a leading metals service centre that provides metals processing and distribution services for a wide range of customers.
In Oct 2021, I concluded that Zeus had poor business economics. Zeus was in a cyclical sector and as such, the fundamental analysis should be based on its performance over the cycle.
The sector is currently in the uptrend part of the cycle and as such you would expect relatively good results compared to its past. But cyclical sectors mean revert.
My valuation showed that the EPV is only 1/6 of the Asset Value. There is only a margin of safety based on the Asset Value The low EPV relative to the Asset Value implied that the Group had not been effective in using its assets.
Could there be risks that my conclusions are wrong?
- A new CEO took over in 2019 and there are signs of the Group divesting the lower returns business and acquiring those with better margins.
- Management continues to report progress in improving the operations even though the impact has not been significant. There could be a turning point when there is a spike in operating efficiencies
My view is that the weight of history is against this. As such Zeus is not one of the better Nasdaq stocks to invest in. You can understand why I do not rate this as a good US stock. For details refer to:
- Olympic Steel - Not Creating Shareholder Value – Seeking Alpha, Oct 2021.
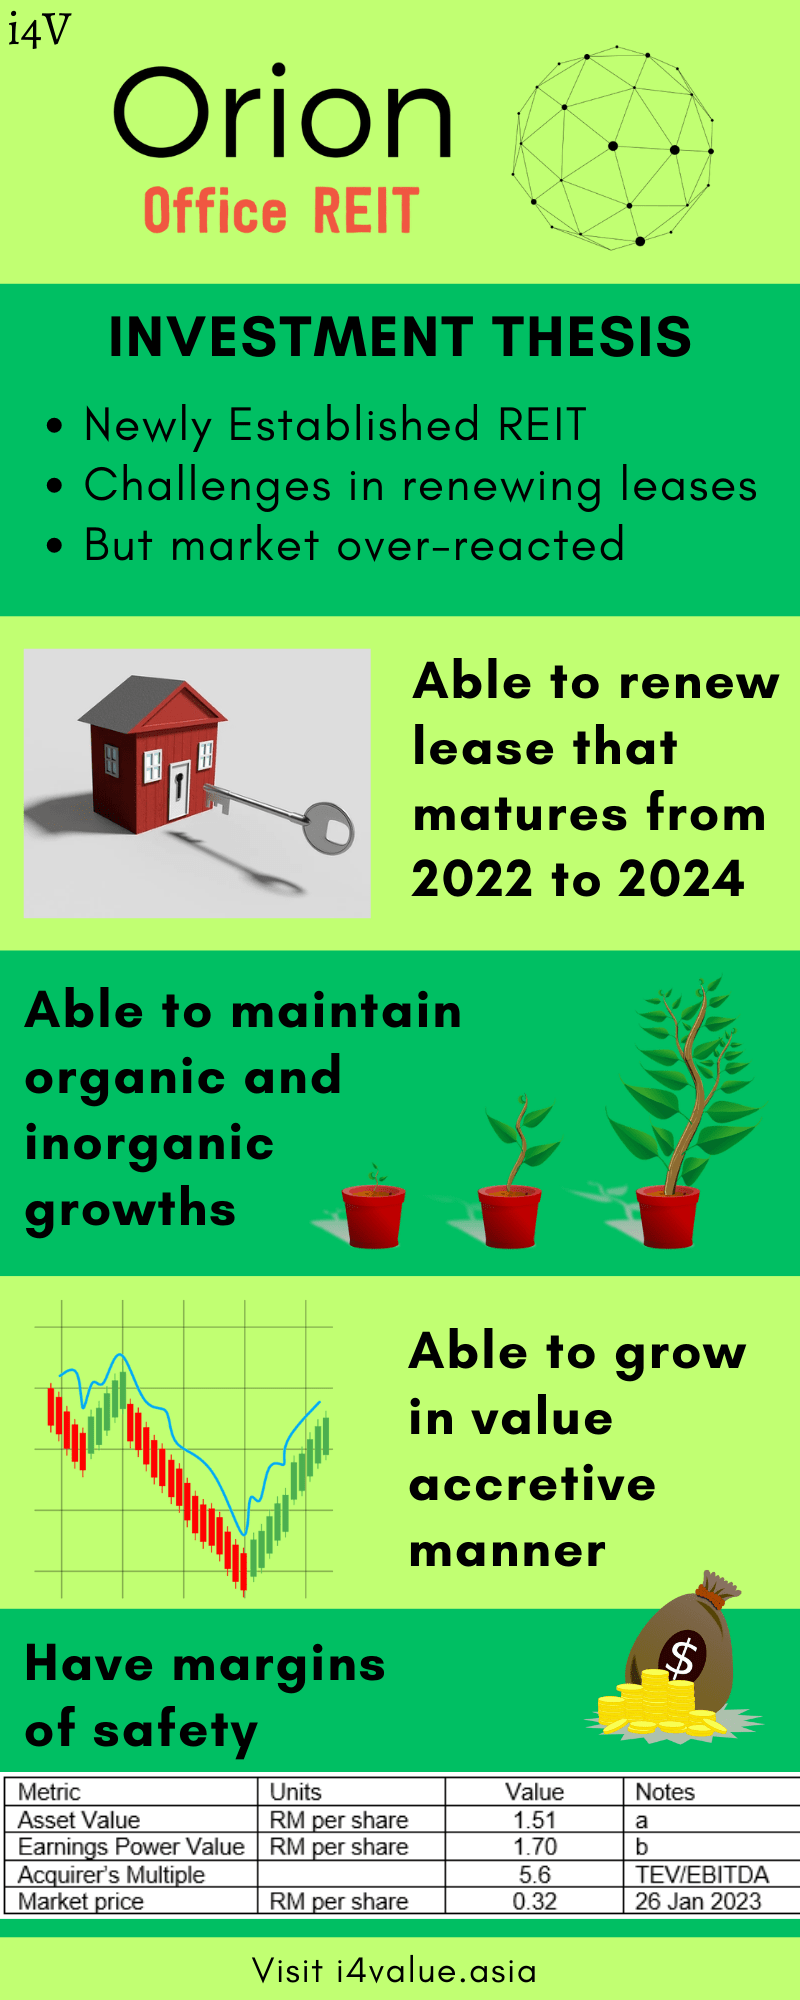
33. Orion Office REIT
Orion Office REIT is a newly established REIT focusing on the single-tenant suburban office market. It started life at a time when the US economy was experiencing high inflation with signs of a recession. This resulted in asset impairments.
About half of the leases will be maturing between 2022 to 2024. It had not been able to renew some of those maturing in 2022. Growth via new properties may also be challenging.
ONL has challenges with the lease renewal. It also had to contend with asset impairments. As such you should not be surprised that the current market price is about half of its “IPO” price. But it has over-shot on the way down as there are margins of safety from a worst-case NAV and FFO perspectives.
The market has overreacted. A conservative analysis shows that the market price is significantly below a worst-case estimate of the NAV and FFO. This is a deep-value investing opportunity with a margin of safety for its current 4% dividend yield. I would rate this REIT as a good US stock.
For details, refer to my Nov 2022 Seeking Alpha article “Orion Office REIT: Value Opportunities”
34. PGT Innovations
PGT Innovations revenue has grown by about 5-fold over the past 10 years. However, this growth was driven more by acquisitions than organic growth. Operating efficiencies did not improve significantly despite the company's growth.
The result is that while there was profit growth over the past 10 years, there was hardly any growth in the operating return and ROE. As such, when growth slows down because of funding constraints or lack of target, we will not have a wonderful company. Moreover, the growth was at an unsustainable Reinvestment rate.
PGTI is now being acquired by Miter Brands at USD 42 per share to be paid in cash. The Board left money on the table. I estimated that at this price, there is a margin of safety
For the shareholders of PGTI, the offer is the best way to exit, as it would be challenging for management to deliver shareholders' value via operations.
For more details, refer to my Feb 2024 Seeking Alpha article “PGT Innovations: The Miter Offer Is Not Good Enough, But There Is No Better Alternative”
35. Pulte
Pulte is a US homebuilder. While I would rate Pulte as financially sound, I would not consider it as a growth one.
During the latest Housing Starts cycle from 2005 to 2022 (peak-to-peak), there was hardly any growth in Pulte's revenue. This was despite several acquisitions in 2016, 2019, and 2020.
Over the past 70 years, there was no growth in the long-term annual average Housing Starts. However, there was growth in the Housing Price Index. I would not consider the sector as a growth one.
As such I valued Pulte based on its Earnings Power Value.
I assumed that the cycle is represented by the 2005 to 2022 performance. This is pegging it to the latest peak-to-peak Housing Starts cycle.
My EPV of Pulte over the cycle showed that there is no margin of safety. The crux of my valuation is that there is no growth in the long-term annual Housing Starts.
Even if you assumed that there is a 1/3 increase in the long-term annual Housing Starts, my analysis showed that there is not enough margin of safety since it would take time to reach this increased level.
There is only a margin of safety if you assumed that Pulte is a non-cyclical company and that the past 2 years’ performance represented its future. This is not a realistic view given the evidence presented.
For details refer to my June 2023 Seeking Alpha article “PulteGroup: No Margin Of Safety Based On A Cyclical Perspective”
36. Reliance Steel & Aluminum
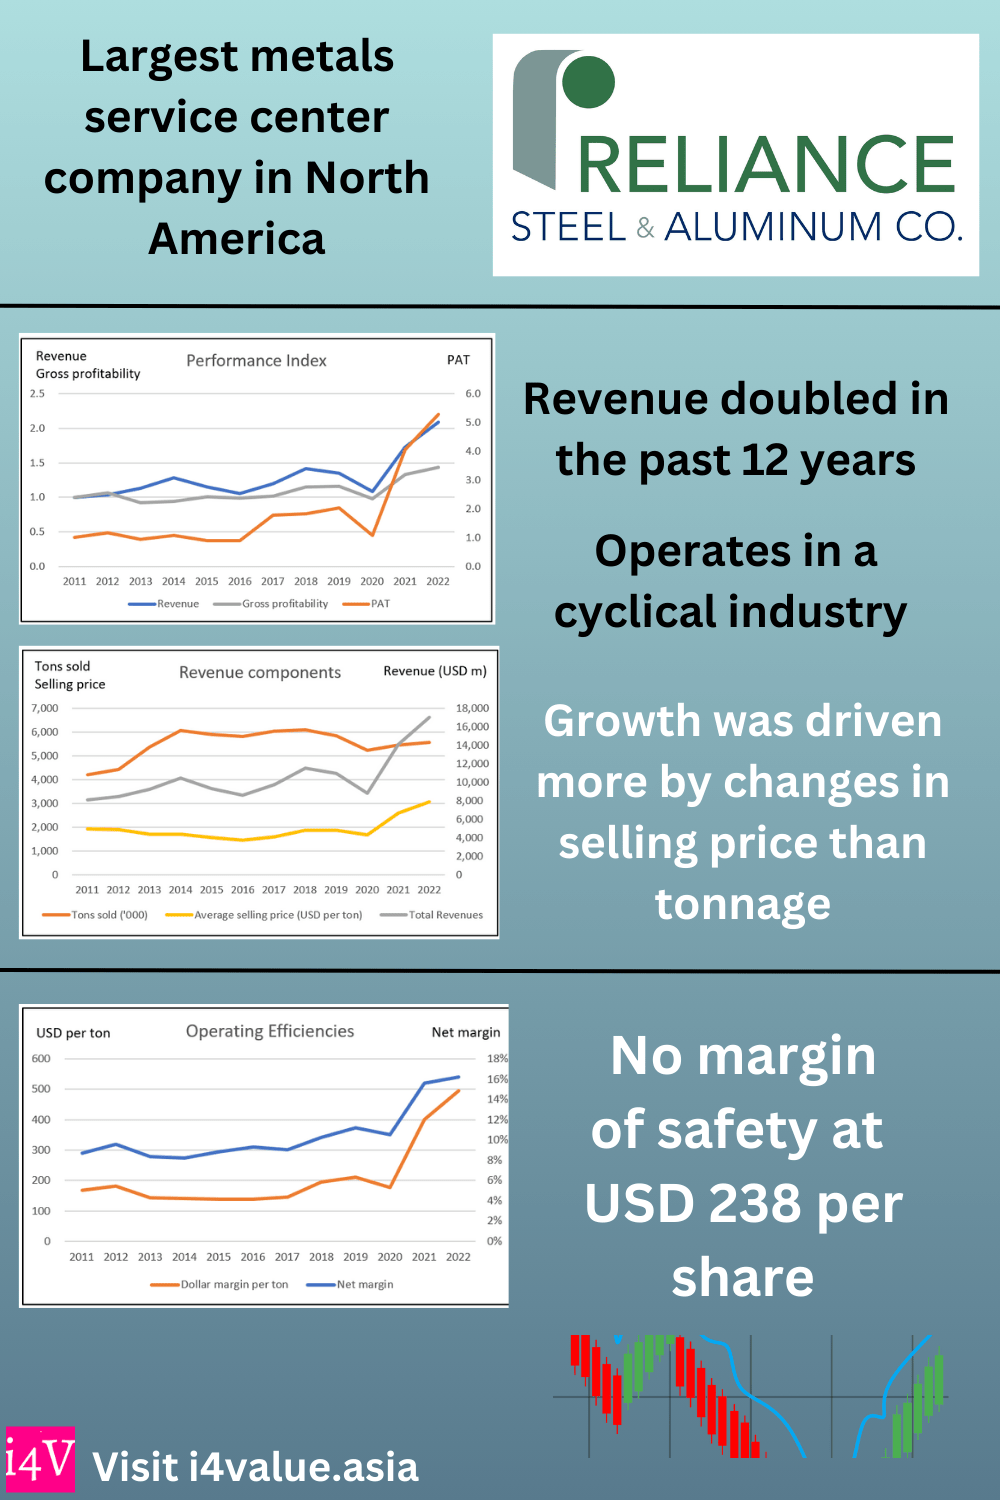
Reliance Steel & Aluminum, (RS) is a leading diversified metal solutions provider and the largest metals service center company in North America.
This is not a high-growth company. Over the past 12 years, shipment tonnage grew at 2.6 % CAGR. Growth was driven more by changes in selling price than tonnage. Growth was also due to organic and acquisition growth.
This is not a high-growth sector but rather a mature one. It is also a cyclical sector.
The company attempted to dampen the effects of the cycle by offering different metals, serving customers in different sectors, and going international. However, my analysis has shown that both the top line and bottom line are still cyclical
Over the cycle, it has been able to improve its operating efficiencies. It is also financially sound. There were improvements in the net margins. But the improvements for other operating parameters such as leverage, gross profitability, and inventory turnover were not so clear-cut.
A valuation of RS over the cycle, taking into account the improvements, showed that there is no margin of safety.
For details refer to my 22 Sep 2023 Seeking Alpha article “Reliance Steel & Aluminum: Not A High Growth Company Despite Acquisitions”
37. Ryerson Holding
While Ryerson (RYI) also has operations in Canada, Mexico, and China, the US accounted for about 91 % of the revenue in 2022. The company is a key intermediary between metal producers and end users of metal products.
From 2014 to 2022, its revenue grew at 7.1 % CAGR. But this was due more to changes in the selling price as there was hardly any tonnage growth despite its acquisitions.
The price growth, especially the price spike in the past 2 years, enabled it to generate strong earnings. But RYI is a cyclical company. This is despite its efforts to mitigate the cyclical effect by distributing a variety of metals and serving customers in diverse sectors.
As such it is more appropriate to analyse and value its performance over the cycle. Over the cycle, it has been able to improve its operating efficiencies. There is a sufficient margin of safety based on its performance over the cycle. As such I would consider RYI an investment opportunity.
For details refer to my 18 Sep 2023 Seeking Alpha article “Ryerson Made Hay While The Sun Shone. But Is The Sun Still Shining?”
38. Sealed Air Corp
Sealed Air Corp (NYSE:SEE) is a global provider of packaging solutions. SEE is a low-growth company in a low-growth global packaging sector. Over the past 6 years, its revenue only grew at 3.1 % CAGR. This was despite having both organic and acquisition growths.
Despite being a low-growth company, SEE was able to deliver double-digit operating returns. It also led its peers when it came to ROA.
It may not be a wonderful company when looking at how it performed under its 2018 Reinvent SEE strategy. But this was looking at improvements from a high starting bar. The company is a profitable one.
The market price has declined since Q1 2022. But I think it had overshot on the way down as there is currently more than a 30% margin of safety. It is an investment opportunity.
For more details, refer to my Feb 2024 Seeking Alpha article “Sealed Air: The Market Has Overshot On Its Way Down”
39. Silgan
Silgan Holdings Inc. (NYSE: SLGN) is a leading manufacturer of sustainable rigid packaging solutions for the world. Although SLGN has worldwide operations, the US accounted for about ¾ of the group's revenue over the past 12 years.
Silgan revenue and earnings revenue and earnings grew by about 80% over the past 12 years. They have grown primarily through acquisitions and price growth, rather than organic growth or volume growth.
Acquisitions were carried out at an unsustainable Reinvestment rate. There were also no uptrends in the ROE and operating parameters. SLGN has a high debt-equity ratio and no signs of strong fundamentals as there were no uptrends in ROE and operating parameters.
There is no margin of safety at the current high product selling prices. There is only a margin of safety if you assume that the current high product prices can be sustained, as well as scaling down the Reinvestment rate to a sustainable level. There are no signs of these.
For details refer to my Sep 2023 Seeking Alpha article “Silgan: The Historical Growth Rate, While Not Fantastic, Is Even Not Sustainable”
40. Simpson Manufacturing
Simpson Manufacturing Co is a fundamentally sound company with improving returns resulting from both revenue growth and improving efficiencies.
Growth was due to organic growth and acquisitions. Acquisitions accounted for a bigger part. I would expect this strategy to continue. But this was from a high reinvestment rate that has to be reduced to a fundamental rate.
Over the past 12 years, it has been able to improve its returns. Apart from growing revenue, there were improving operating efficiencies.
The company is also financially sound with a good capital allocation plan. These will support its acquisitions. Unfortunately, there is not enough margin of safety even when valuing SSD using a 2-stage-growth model.
For more details refer to my Dec 2023 Seeking Alpha article “Simpson Manufacturing: Not Enough Margin Of Safety For This 'Wonderful' Company”.”
41. Sleep Number
The company has repositioned itself as a wellness technology company, known for its innovative Sleep Number beds.
Over the past 8 years, Sleep Number revenue grew at 11.1 % CAGR. But this was driven more by price growth than volume growth. In this context, I would not consider SNBR a high-growth company.
From a fundamental perspective, the company is an average performer. There were both plusses and minuses in the performances of the various metrics.
But I believe there is more than a 30 % margin of safety even when valuing SNBR based on the Earnings Power Value.
For more details refer to my Dec 2023 Seeking Alpha article “Sleep Number: Not A High Growth Company, But An Investment Opportunity”
42. Smurfit Kappa
Smurfit Kappa Group Plc (SKG) is one of the leading providers of paper-based packaging solutions in the world. Its products include containerboard, corrugated containers, and other paper-based packaging products. SKG has two reportable segments – Europe and Americas.
SKG is fundamentally sound. Its returns are greater than its cost of funds and there are signs of improving operating efficiencies.
The challenge is that there is not enough margin of safety at the current price. But this is based on the view that the future would be similar to the past. This is set to change with the proposed acquisition of WestRock Company (WRK).
The acquisition would more than double the size of SKG. WestRock's historical return is about half of that of SKG. There would be a margin of safety if SKG could improve WestRock's operations making SKG an investment opportunity.
At the same time, I believe it is better for WestRock shareholders to accept SKG's offer rather than sell it for cash given the potential to improve the WestRock operations.
For details refer to my Nov 2023 Seeking Alpha article “Smurfit Kappa: Leveraging Its Track Record To Create Value From The Proposed WestRock Acquisition”
I also had another article specifically exploring the synergies from the acquisition of WestRock.
The value of the synergies will impact the intrinsic value of the combined entity, with Smurfit Kappa likely to drive the synergies due to its better operating track record.
The intrinsic value of Smurfit WestRock with synergies ranges from USD 49 to USD 59 per share, providing more than a 30% margin of safety compared to current market prices.
Refer to the Dec 2023 Seeking Alpha article titled "Smurfit Kappa And WestRock: Exploring The Value Of Synergy”
43. Stelco
Stelco is a Canadian integrated steel manufacturer that was at one time part of the US Steel Group. Its present corporate set-up followed its divestment by US Steel and a re-structuring and 2017 IPO.
Stelco is in a cyclical sector. As such, I analyzed and valued Stelco based on its performance over the cycle. The challenge with Stelco is that data was only available from its IPO year of 2017.
Given this, I took the 2018 to 2020 average values to represent the performance over the cycle. This is based on looking at the past 20 years’ steel cycle pattern and ignoring the past year or so prices.
Stelco is fundamentally strong with a strong growth track record.
- It is financially sound. As of Jun 2022, Stelco has a Total Capital Employed of CAN$ 2.6 billion. About ¾ of this is funded by equity. The company is cash rich with cash accounting for about 57% of the Total Capital Employed.
- It has a good track record. Compared to the top 4 US steel companies, Stelco’s revenue growth and ROA stand out as illustrated in Charts 3 and 4.
- It has a Piotroski F Score of 8 for 2021.
There are margins of safety based on its EPV over the cycle matches the current market price. There are other upsides because of Stelco’s growth track record. At the same time, the steel demand is expected to grow given the recently passed infrastructure plan. This is a good US stock.
For details, refer to my Seeking Alpha articles:
44. Steel Dynamics
Nasdaq-listed Steel Dynamics Inc (SDI or the Group) is an iron and steel Group that can be considered a good company because of the following:
- It is financially strong. The Group has the industry average debt-to-capital ratio while having a higher than industry cash position.
- Both the Steel and Steel Fabrication segments are generating returns that appear to be higher than the cost of funds. While the Metal recycling segment has not performed, it may have contributed to the Steel segment's performance.
- SDI physical steel external shipment has grown at a CAGR of 7.4 % over the past 10 years compared to the USA steel consumption CAGR of 2.3 %. SDI has increased its market share in the USA market.
At the current market price, it is obvious that SDI is not a value trap as it is not cheap from the perspective of the past 12 months' prices. What is the investment thesis then?
- This is Group with a strong growth track record and a leadership team that is a good operator and capital allocator.
- The Biden administration will unfold an economic stimulus plan that will spur the demand for steel. I expect the trade protection measures to continue to provide import replacement opportunities.
The main investment risk at the current price is that even for a 7% margin of safety, you have to assume that SDI can grow according to the long-run US GDP nominal growth rate.
However, I believe that SDI will report a declining profit in 2021/22 with the opening of the new mill. I do expect the market to have a knee-jerk reaction that will provide you with a better buying opportunity. I consider this a good US company.
Over the years, I have also written about Steel Dynamics for Seeking Alpha. Refer to:
- Steel Dynamics: Still Not A Time To Buy - Mac 2021
45. Summit Materials
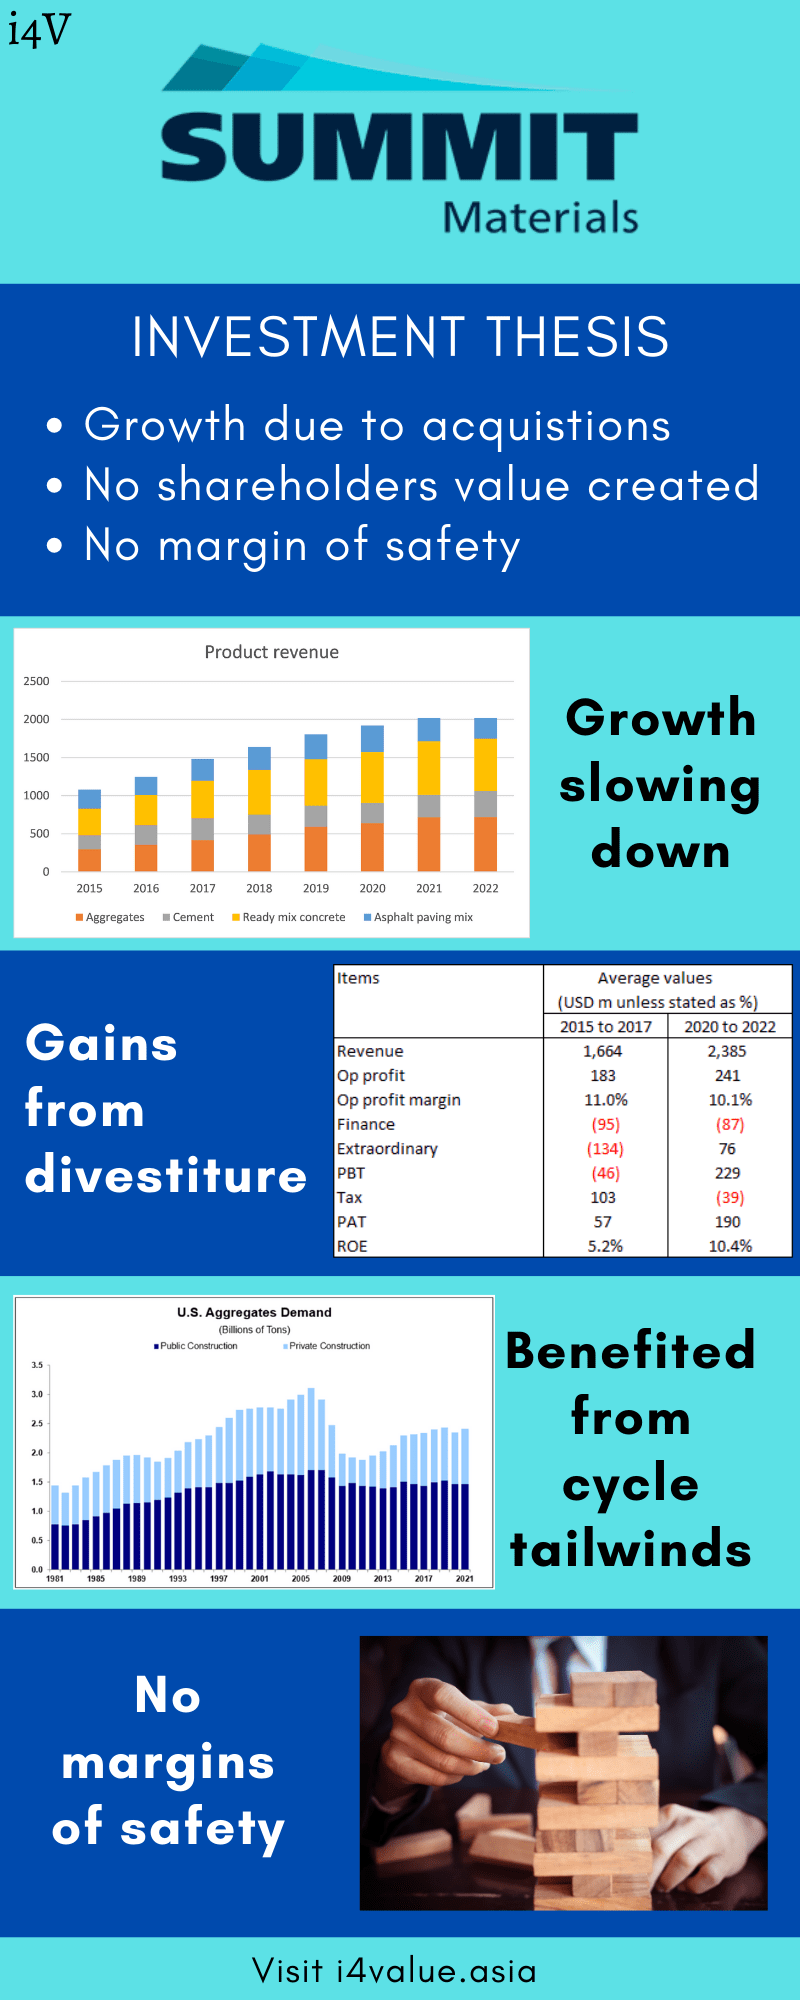
Summit Materials Inc. IPOed in 2015. Its rapid growth before that was due in large part to its acquisitions which were funded with Equity and Debt.
Post-IPO, SUM continued with the same acquisition strategy. But it had managed to reduce its Debt level partly through new Equity as well as Cashflow from Ops.
Revenue growth benefited from being in the uptrend part of the construction cycle. Revenue growth did not translate into better operating performance. Without the one-off gains, the current ROE would be in single digits.
Sadly, this growth has not created shareholders’ value due to its poor business performance. Until SUM can improve its returns, there is no margin of safety for the retail investor
The market priced SUM as a growth stock. Alternatively, the market thinks that the value of the reserves is not accounted for. In either case, the market is wrong.
Refer to my Mac 2023 Seeking Alpha article “Summit Materials: A Growth Trap For The Retail Investor”
46. Trane Technologies
The present form of Trane Technologies plc came from its 2020 restructuring to focus on the heating, ventilation, air-conditioning, and related operations.
The company was incorporated in 2009 as Ingersoll-Rand Plc. In those days its business segments consisted of Climate and Industrial, both with strong brands and leading positions within their respective markets. Following the restructuring, the company was renamed Trane Technologies.
This restructuring was the right move as the company delivered double-digit returns and growth since then.
The company is financially sound with improving operating efficiencies. I would rate TT as fundamentally sound. However, there is no margin of safety even when valuing TT based on a 2-stage growth model
For more details refer to my Feb 2024 Seeking Alpha article “Trane Technologies: Fundamentally Sound But Without Any Margin Of Safety”
47. Tempur-Sealy
Tempur-Sealy International Inc (TPX) is an NYSE-listed global bedding company. The Group is one of the top 2 bedding industry leaders in the US market.
The bedding industry is not a sunset industry. TPX's two business segments - North America and International - still have organic growth prospects. The industry growth in the US seemed to have been driven by the growth in Housing Starts. But this is not long-term sustainable growth.
My investment thesis is that TPX is a growth trap.
- TPX achieved a lower revenue growth rate compared to the industry.
- In the past 3 years, EBIT/TCE employed averaged 19 %. This is commendable at it is above the cost of funds. But TPX Return on Assets is the worst among its peers.
- While it has created shareholders' value, the share buyback plan was carried out at prices that were greater than the intrinsic value.
- The current market price far exceeds the EPV.
The market is pricing TPX as if it was a high-growth stock. I have shown that it has short-term revenue boosters ie from Housing Starts and anti-dumping. But the long-term outlook is likely to be growth at the US long-term GDP rates.
The current business economics of the Group is good. It is a good US stock. In the short run, it can even overshadow some of the non-value-adding decisions. But if management does not take advantage of this to make the necessary changes, TPX may not have a bright future in the long run.
Over the years, I have also written about the Group for Seeking Alpha. Refer to
- Tempur-Sealy: Time To Exit - Feb 2021
- Tempur Sealy: Still Not The Time To Buy - May 2021
48. Ternium
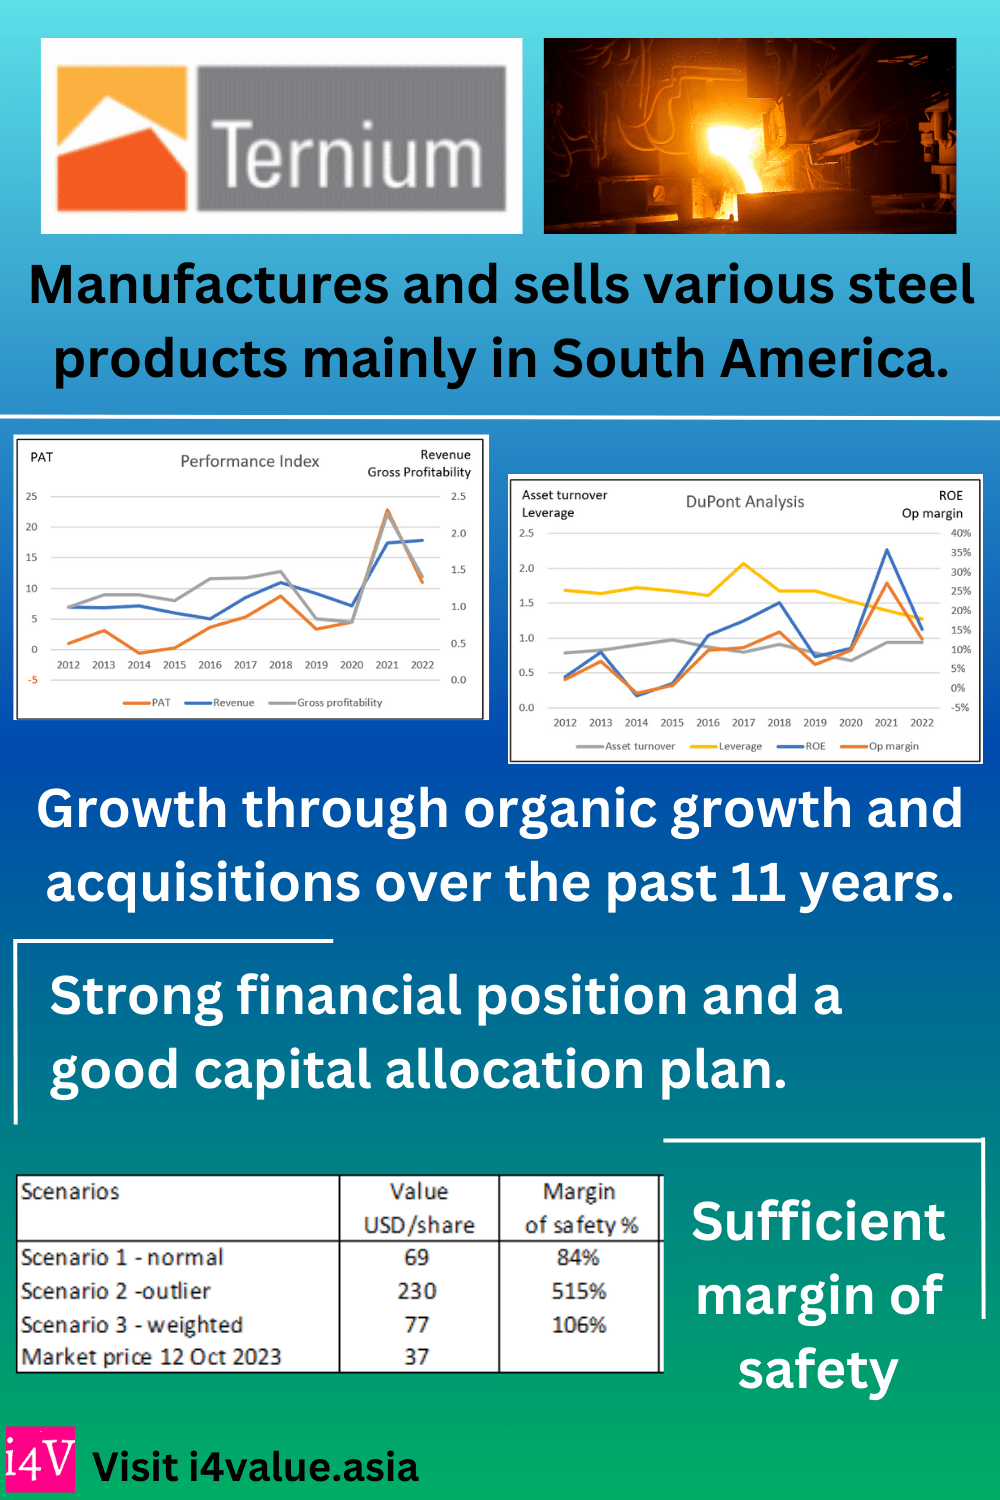
Ternium S.A. (NYSE: TX) together with its subsidiaries, manufactures, processes, and sells various steel products mainly in South America. Although it has some mining operations, these serve mainly in-house and are a small component relative to the steel output. For example, in 2022, its mining sales were only 3% of its total revenue.
Ternium S.A. has achieved revenue and profit growth through organic growth and acquisitions over the past 11 years. It has doubled its revenue and achieved a growing ROE with corresponding improvements in operating efficiencies.
It also has a strong financial position and a good capital allocation plan, creating value for shareholders.
My valuation of TX over the steel price cycle showed that there is more than a sufficient margin of safety. Together with its strong financial position, I would consider this an investment opportunity.
For details refer to my Oct 2023 Seeking Alpha article titled “Ternium: Improving Fundamentals And Good Margin Of Safety”
49. Timken Steel
Except for its IPO year of 2014, Timken Steel (TMST) had not been profitable since then. However, the Group is financially strong, and a breakeven analysis showed that the poor performance is due to its operating below its breakeven levels.
The prospects of lower fixed costs, higher selling prices, and larger sales volume meant TMST would be able to be profitable. Given TMST's technical expertise and customer relationships, if it can get align its cost structure with the cyclical product prices, it would be able to turn around.
There is a new CEO/President starting work in Jan 2021. This could be a catalyst to turn the Group around.
The Investment Thesis is that TMST would be able to turn the Group around. If this is achieved there is a sufficient margin of safety at the current market price.
If it failed, the current market price is 1.1 times the Book Value. This would limit the downside if the turnaround is not successful. It is a good US stock.
I have now several updates in Seeking Alpha:
50. Toll Brothers
Toll Brothers is US homebuilder and hence a cyclical company. Any analysis and valuation should be based on a cyclical lens.
During the latest Housing Starts cycle from 2005 to 2022 (peak-to-peak), its revenue grew at 3 % CAGR. But this was due to a combination of 1.1 % CAGR in Deliveries while unit selling price grew at 1.8 % CAGR. Part of the growth was due to the 2014 acquisition.
Over the past 70 years, there was no growth in the long-term annual average Housing Starts. However, there was growth in the Housing Price Index. I would not consider the sector as a growth one. But TOL is financially sound.
A valuation of TOL over the cycle on such a basis showed that there is no margin of safety. Even if you assumed that there would be a 1/3 increase in the long-term annual average Housing Starts, the margin of safety is not sufficient.
For details, refer to my May 2023 Seeking Alpha article “Toll Brothers: No Margin Of Safety Even With Uptick In Long-Term Annual Average Housing Starts”
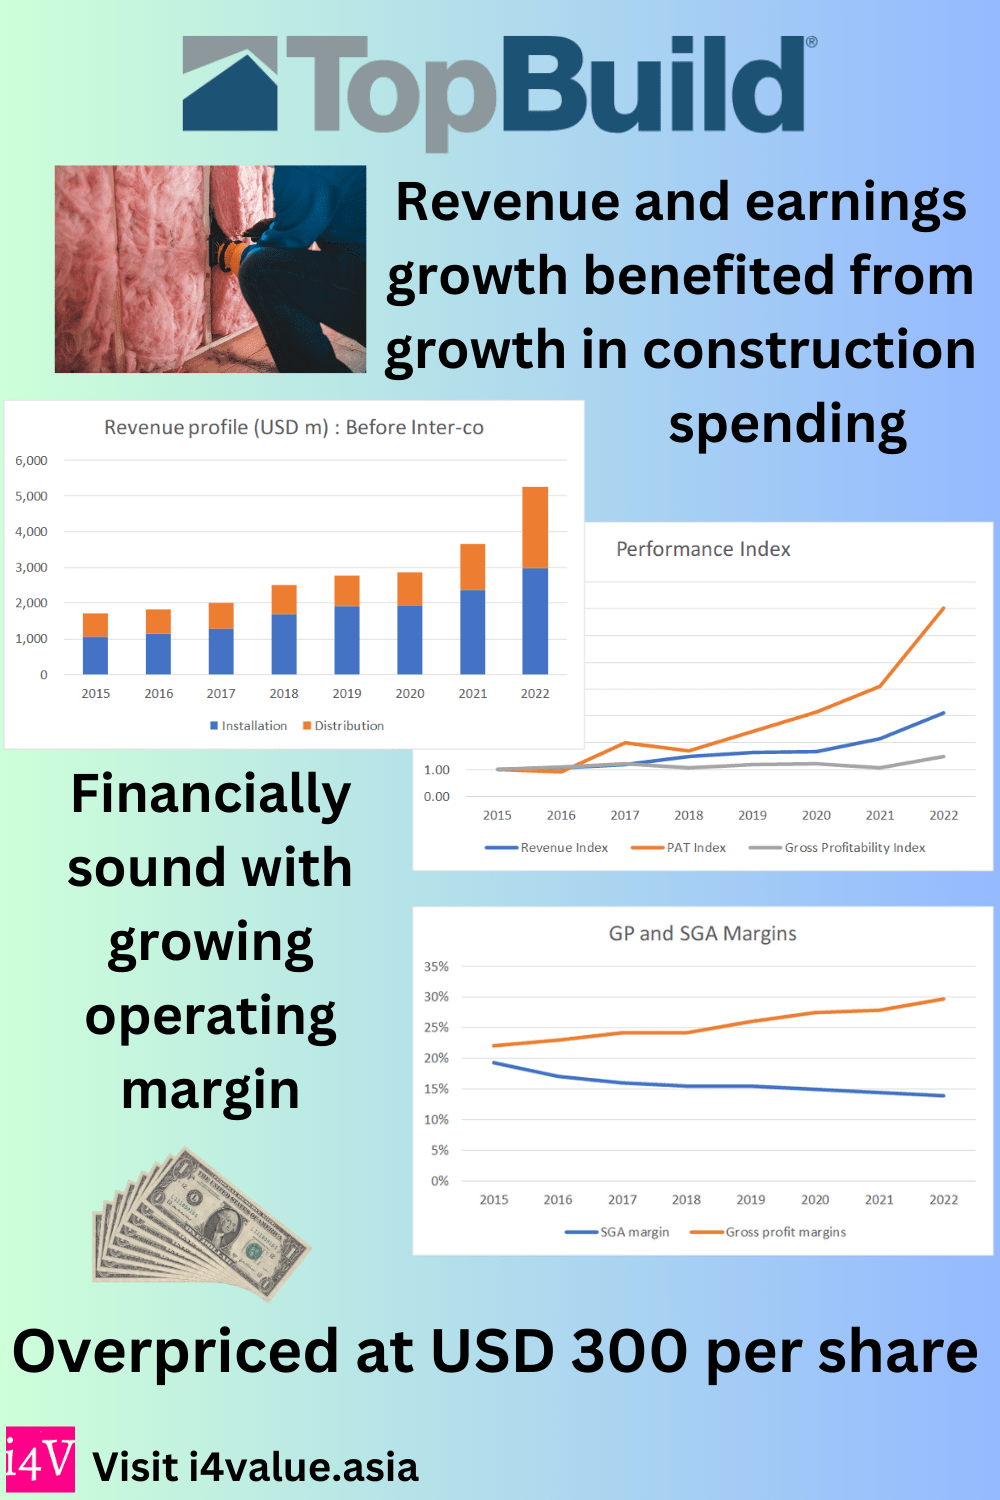
51. TopBuild Corp
TopBuild Corp (BLD) is a leading installer and distributor of insulation and other building material products for the US and Canadian construction sectors.
Over the past 8 years, BLD has benefited from the growth in total construction spending. The company used the tailwinds to grow its revenue and profits. But the profit growth was driven more by price (margins) growth rather than improvements in capital efficiency.
All seems rosy because of the growing total construction spending. The construction sector is cyclical, and the company has positioned itself to mitigate the cyclical impact:
- It had reduced the contribution from the residential market.
- It had improved its gross profit and SGA margins.
- Its higher market share meant wider reach.
But I have some concerns about its financial position. If the construction sector continues to be strong over the next few years, this financial position would not be an issue because of its strong cash generation ability.
But while fundamentally sound, the market has overpriced the stock. Based on an optimistic 2-stage valuation model, there is no margin of safety.
For details, refer to my 15 Aug 2023 Seeking Alpha article “TopBuild Corp.: Benefiting From Growing Construction Spending, But I See No Margin Of Safety”
52. Tredegar
Tredegar Corporation (NYSE: TG) is an industrial manufacturer with three primary businesses - aluminum extrusions, polyethylene (PE) plastic films, and polyester or flexible packaging (FP) films.
Tredegar was formed in 1989 when the aluminum, plastics, and energy units of Ethyl Corporation were spun off. The energy-related assets were subsequently sold in 1994.
This is a company undergoing a business transition. 10 years ago, it was predominantly a plastic business with an aluminum extrusion business. Today, it is an aluminum extrusion company with a plastic arm.
The company is fundamentally sound with improving operating efficiencies. This has led to improving ROE. It is also financially sound with a low Reinvestment rate and a good capital allocation track record.
However, the company operates in a cyclical sector and current valuations do not offer enough margin of safety. While I would not invest at the current market price, the price has been trending downward for the past few years. It is possible to go further, and I would go in when it reaches USD 4 per share.
For details, refer to my Oct 2023 Seeking Alpha article “Tredegar: A Brighter Future But Not A Value Buy Yet”
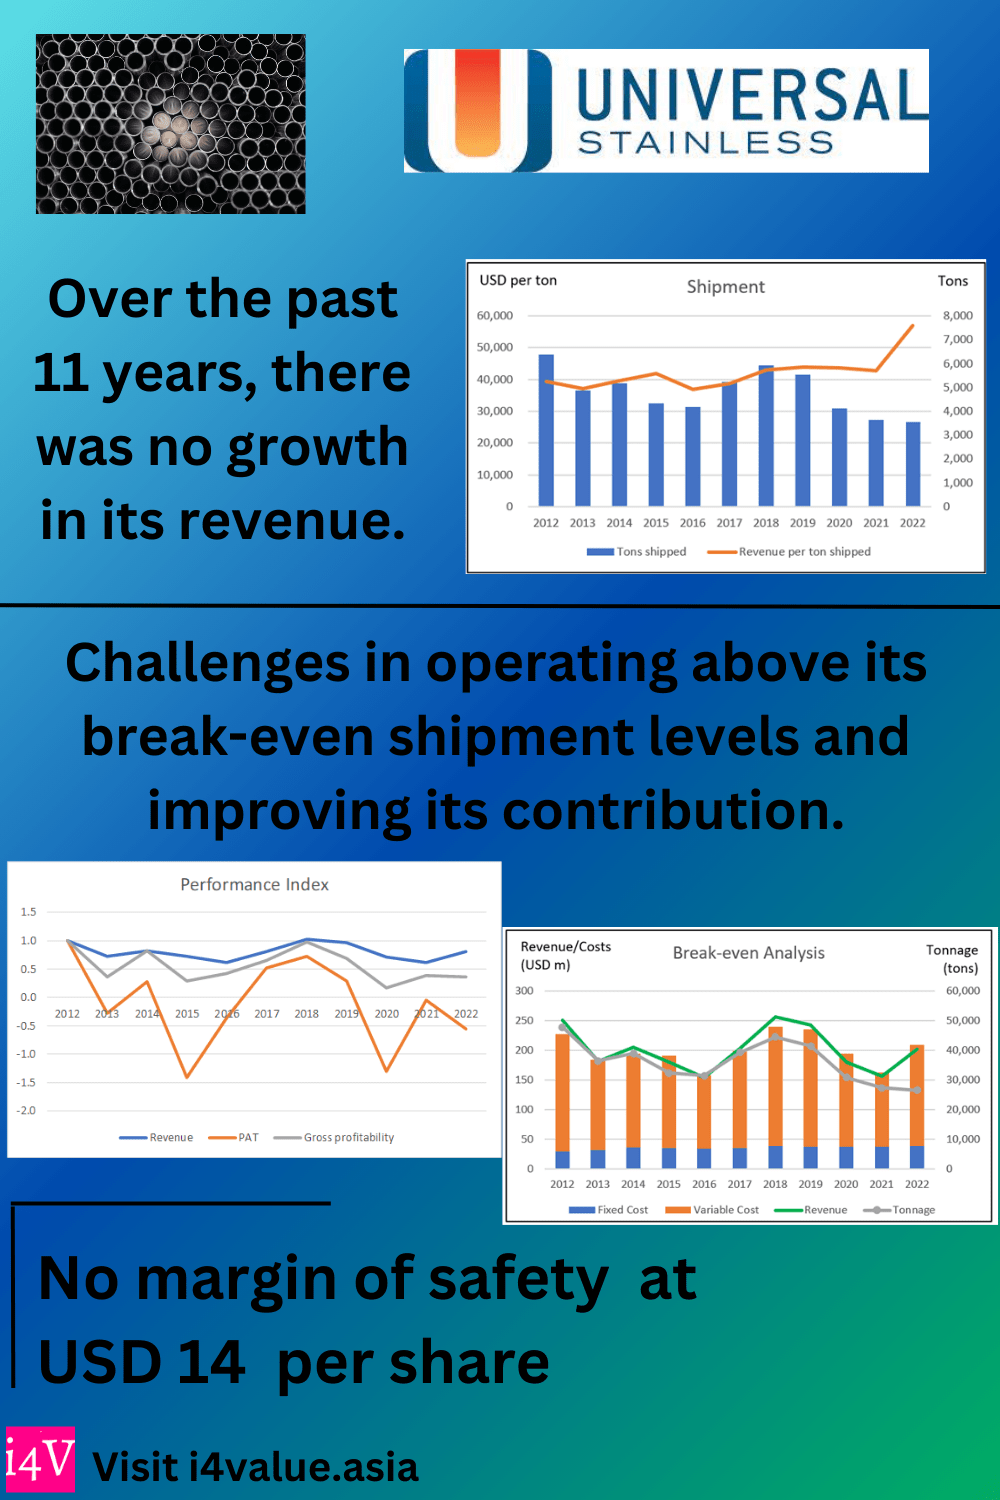
53. Universal Steel & Stainless
Universal Steel & Stainless (USAP) manufactures and markets semi-finished and finished specialty steel products.
Over the past 11 years, USAP was not able to grow its revenue. Its profits were volatile. The company faces challenges in operating above its break-even shipment levels and improving its Contribution (revenue minus variable cost). On a cumulative basis, the company just broke even.
I also have concerns about its financial strengths. At first sight, it is not a fundamentally sound company. But I wanted to see whether there are turnaround opportunities.
My analysis shows that to be profitable, the company needs to address its shipment tonnage and improve the Contribution.
At the same time, it must be able to grow. This probably meant a growing shipment tonnage. If the company can deliver these, there will then be a margin of safety. The Contribution improvement does not look far-fetched. But the shipment tonnage target is a big challenge.
There is no track record to suggest that this shipment target is sustainable. You can understand why I would not invest in USAP.
For details, refer to my 4 Sep 2023 Seeking Alpha article “Universal Stainless & Alloy Products: Its Problem Is That It Is Operating Below Break-Even”
54. US Steel
United States Steel Corporation (X) has transformed itself over the past 10 years. It has reduced its capacity to match its demand and diversified to making steel via EAF mini-mills. Apart from improving its business operations, X has today a stronger balance sheet.
Any analysis and valuation of X should be based on this “transformed” profile. At the same time, steel is a cyclical sector. A valuation of X on such bases shows that there is a margin of safety at the current price of USD 25.50 per share (as of 6 June 2022). It is a good US stock.
I also analysed X from another perspective. X can be considered of comprising 3 divisions – the US, Tubular, and Europe. The US division covers the company’s US flats and the mini-mill segments. The Tubular and Europe divisions are the US tubular and USSE segments
From 2013 to 2021, the main contributor has been the US division. The Tubular division has not generated any cumulative returns. Europe, while profitable, currently faces market and supply risks due to the Ukraine invasion.
The market price has already priced in the downside from Europe. I reached this conclusion based on a sum-of-parts valuation of X.
For details refer to the following:
- U.S. Steel: A Different Group Than 9 Years Ago – Seeking Alpha, June 2022.
- U.S. Steel: Value Is There Even Without Any Contribution From Europe - Seeking Alpha, Aug 2022.
- United States Steel: Better Positioned For The Coming Recession – Seeking Alpha, Apr 2023.
55. Vulcan
Vulcan Materials Company is the largest construction aggregates company in the US. The demand (tonnage) for aggregates in the US is cyclical. While it delivered credible performance over the past 2 years, VMC’s performance over the cycle is lower than the current results.
Notwithstanding its acquisitions, it did not achieve significant growth in its market share. Shipment tonnage over the past 15 years was stagnant and revenue growth was driven by growth in prices. At the same time, it had unsustainable Reinvestment rates.
Based on its valuation over the cycle, there is no margin of safety at the current price. This low value is due to the low cyclical margins, low revenue base, and low cyclical asset turnover.
Refer to my Feb 2023 Seeking Alpha article “Vulcan Materials: No Fundamental Basis For The High Price”.
56. Walgreen Boots Alliance
Walgreen Boots Alliance (WBA) today is very different from what it was in 2014. Apart from being about 2 ½ times bigger in size in terms of Total Assets, it had just diversified into local clinical care services. There were also additional expenses associated with its Cost Transformation Program (Cost Program).
I would consider WBA as a company in transition. The current performance does not capture the full benefits of the new business segment as well as the cost savings.
There are 2 drivers of change:
- The venture into the business as represented by the US Healthcare segment.
- The Cost Program.
Management has committed to the benefits of the Cost Program. There is a strong operating track record to suggest that it would be successful in its transformation. It is also financially strong to give it time to realize the results
Assuming that both are achieved, then there is a margin of safety at the current price.
However, the success of the US Healthcare segment is still to be proven. I do not expect the US Healthcare segment to be a failure given the management track record. But even if this happens, there is enough margin of safety. It is a good US stock.
For details, refer to my Oct 2022 article in Seeking Alpha “Walgreens Boots Alliance - A Company In Transition”
57. WestRock
The WestRock Company (NYSE: WRK) that you see today resulted from 2 major restructuring/corporate excises.
- The 2019 acquisition of KapStone. This a leading North American producer and distributor of containerboard, corrugated products, and specialty papers.
- The 2015 formation of WRK to merge the businesses of several companies in the paper and packaging sector. Technically, WRK did not have any operations before this 2015 formation.
WRK's revenue grew at a 7.8% CAGR over the past 9 years. This was due to the combination of organic growth, acquisitions and product price tailwinds.
The operating returns achieved by the company were lower than its cost of funds. Growth did not create shareholders' value. It also incurred high impairment charges. This suggests issues with its ability to negotiate good prices for the acquisitions.
While it is a cash cow, this was negated by its poor capital allocation plan. At the same time, while there are signs of operating improvements, this has yet to translate into better returns.
In addition to these fundamental issues, there is not enough margin of safety. This is neither an investment opportunity nor a short one. I recommend a hold.
For details, refer to my Nov 2023 article in Seeking Alpha “WestRock Acquisitions Did Not Create Shareholder Value”
Note that WestRock is being acquired by Smurfit Kappa Group (SKG). As such you should also refer to the relevant articles on SKG in this article for more detailed look at WestRock.
58. Worthington Industries
The Group today has 2 major business segments - Steel Processing and Pressure Cylinders. The analysis suggested that WOR is a good company.
- It has been profitable over the past 11 years. This covered 2 hot-rolled steel price cycles and the Covid-19 pandemic.
- It is financially sound with a Debt Equity level lower than the industry average. As of Feb 2021, cash represented 29 % of the total capital employed.
- It has a good track record of growing shareholders’ value.
- The sustained excess returns and the EPV > AV scenario suggested that it has a sustainable competitive edge.
- While there may be limited opportunities for high growth in the US, there is a global demand for its Pressure Cylinder segment products.
At the current price, there is no margin of safety from the EPV perspective. I would argue that there is also no margin of safety from a Conservative Earning with a 2 % growth perspective.
For the price to go higher and hence project some justification for buying, you would have to view WOR as a growth stock.
But the analysis did not provide any evidence of a high growth phase. If you invest based on a high growth expectation, it would be investing in a growth trap. Would you consider company this a good US stock?
I have the following updates:
- Worthington Industries - A Sufficient Margin Of Safety Even As A Cyclical Company – Mac 2022 in Seeking Alpha.
- WOR is still one of the better NYSE stocks – May 2022 in i4value blog.
- Worthington Industries: Sum Of Parts Is Greater Than The Whole – Apr 2023 in Seeking Alpha.
Note: I have another list of stocks that I analyzed in 2025. Refer to "My curated US stocks for 2025"
END
- - - - - - - - - - - - - - - - - - - - - - - - - - - - - - - - - -
- - - - - - - - - - - - - - - - - - - - - - - - - - - - - - - - - -
How to be an Authoritative Source, Share This Post
If the above article was useful, you can find more insights on how to make money in my e-book. The e-book is now available from Amazon, Kobo and Google Play.
PS: If you are in Malaysia or Singapore, the e-book can only be download from Kobo and Google Play.
How to be an Authoritative Source, Share This Post
|
Disclaimer & DisclosureI am not an investment adviser, security analyst, or stockbroker. The contents are meant for educational purposes and should not be taken as any recommendation to purchase or dispose of shares in the featured companies. Investments or strategies mentioned on this website may not be suitable for you and you should have your own independent decision regarding them.
The opinions expressed here are based on information I consider reliable but I do not warrant its completeness or accuracy and should not be relied on as such.
I may have equity interests in some of the companies featured.
This blog is reader-supported. When you buy through links in the post, the blog will earn a small commission. The payment comes from the retailer and not from you.
Disclaimer & Disclosure
I am not an investment adviser, security analyst, or stockbroker. The contents are meant for educational purposes and should not be taken as any recommendation to purchase or dispose of shares in the featured companies. Investments or strategies mentioned on this website may not be suitable for you and you should have your own independent decision regarding them.
The opinions expressed here are based on information I consider reliable but I do not warrant its completeness or accuracy and should not be relied on as such.
I may have equity interests in some of the companies featured.
This blog is reader-supported. When you buy through links in the post, the blog will earn a small commission. The payment comes from the retailer and not from you.
























Comments
Post a Comment