Is KFIMA one of the better Bursa stocks?
Value Investing Case Study 14-4. KFIMA: An undervalued diversified gem or a true turnaround story? Discover its real potential!
I first covered Kumpulan Fima (KFIMA or the Group) in May 2021. It was then trading at RM 1.92 per share (as of 28 April 2021) compared to its Book Value of RM 2.90 per share (as of the end of Dec 2020).
The market price has since dropped to RM 1.82 per share (as of 4 Dec 2023) while the Book Value had grown to RM 3.33 per share (as of the end of March 2033).
The current market price is a significant discount on the Book Value considering that this is a brick-and-mortar group. The Group has been profitable over the past 12 years.
Is the market suggesting that its assets are overvalued and/or that the Group is going to face some insurmountable problems? Is KFIMA a value trap?
For a company to be a value trap, the cheap price must be because there is a real reason for it. The trap springs after you have bought it.
I will provide an updated fundamental analysis and valuation of KFIMA to show why it is not a value trap. Where relevant I have also incorporated some of the analysis from my earlier articles. If you had tried to access my previous articles, you would have been redirected here.
To be transparent I own KFIMA shares at an average price of RM 2.23 per share. I have been holding them for about 9 years.
Should you go and buy it? Well, read my Disclaimer.
Contents
- Investment thesis
- Business background
- Operating trend
- Financial position
- Risks
- Valuation
- KFIMA is one of the better Bursa companies
|
Investment Thesis
KFIMA did not achieve any revenue growth over the past 12 years. But this was due to the loss of a major supply contract. The Group had managed to offset this by growing the business in the 3 other segments – Plantation, Food, and Bulking.
The returns with the current business profile have yet to reach the levels of that prior to the loss of the supply contract. But the Group is making progress.
The Group is fundamentally sound. It has managed to deliver returns that were greater than the cost of capital. It is financially sound with a good capital allocation plan.
At the same time, there is a sufficient margin of safety based on both the Asset Value and Earnings Power Value.
|
Business background
KFIMA was incorporated by the Malaysian Government in 1972 with the canning of pineapples as its first business.
In 1981, KFIMA became the controlling shareholder of Fima Metal Box Bhd, now known as Fima Corporation Bhd (Fima Corp).
A decade later, KFIMA underwent a Management Buy-Out in line with the privatization policy of the Malaysian Government. In 1996 KFima was listed on the Main Board of Bursa Malaysia.
Today, KFIMA is a diversified group with 4 core business divisions - Manufacturing, Plantation, Bulking, and Food. They have also expanded beyond Malaysia to Indonesia and Papua New Guinea.
- Manufacturing. The Group is the largest domestic security printer in Malaysia. It has a wide range of products and services eg travel documents and licenses. The Group also operates Malaysia's only banknote printing plant.
- Plantation. KFIMA is involved in the development, cultivation, and management of oil palm and pineapple estates. The Group currently owns and operates 16 estates in Malaysia and Indonesia with a land bank totalling 18,596 hectares.
- Bulking. The Group's Bulking division operates five liquid bulk terminals. Three of them are located in Port Klang while the other two are in Butterworth. This division handles and stores various types of liquids. It also provides transportation and forwarding services.
- Food. This division manufactures and distributes canned fish in Papua New Guinea. It also provides third-party food packaging services.
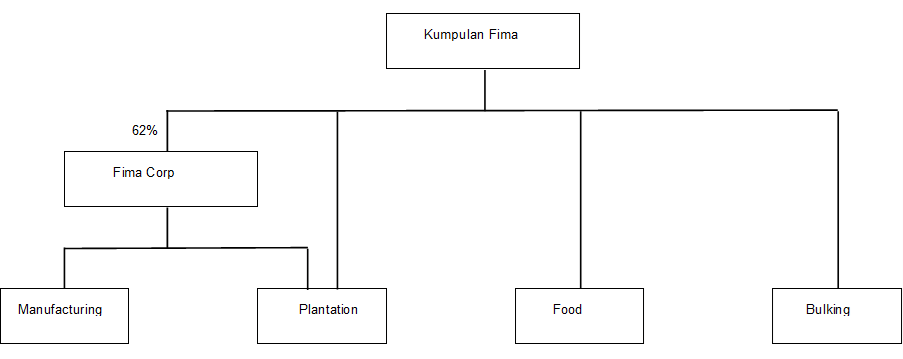
The Group comprises two listed entities with oil palm plantations as the common business.
- Kumpulan Fima Bhd. The core businesses are plantation, food processing, and bulking.
- Fima Corporation Bhd (Fima Corp) - this is a 62% owned subsidiary of Kumpulan Fima Bhd. The core businesses are manufacturing and plantations.
The chart below illustrates the linkage between these two listed entities.
 |
| Chart 1: Business Structure |
Segment performance
To give you a sense of the size and returns achieved by each of the business segments, I look at the past 12 years' time-weighted average revenue and EBIT. I then estimate the 2023 total capital employed (TCE) defined as equity + debt – cash.
Chart 2 shows the Manufacturing segment delivered the best return as measured by the EBIT/TCE. The Plantation business achieved the worst return even though it employed the largest capital.
At the same time, the returns from cash and securities were not significant to offset the inter-co eliminations.
 |
| Chart 2: Segment returns |
|
Operating trends
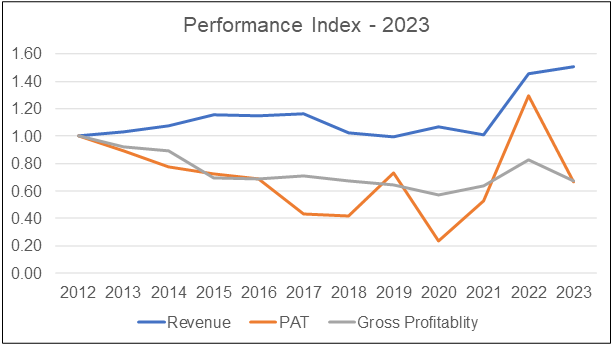
I looked at 3 metrics to get an overview of the overall performance – revenue, PAT, and gross profitability (gross profits / total assets). Refer to Chart 3.
- The bulk of the revenue growth came over the past 2 years.
- PAT and gross profitability showed a declining trend.
 |
| Chart 3: Performance Index |
How did the Group get here?
Although the Group started in the canning of pineapples, over the years it had ventured into non-food sectors. These include such diverse businesses as security printing, stock-broking, and trading.
Not all the new ventures were success stories and by 2009, the Group had exited the non-profitable ones to focus on the current 4 divisions. In fact, in 2009, the Group even decided to exit from the pineapple canning business.
From an operations perspective, the Group looks like a conglomerate. It has 4 diverse businesses - security printing, plantations, food, and bulking.
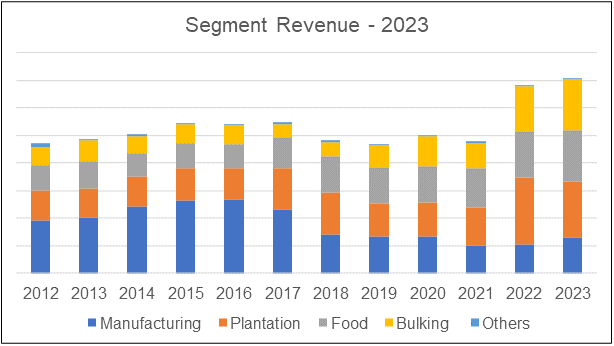
The Group’s revenue has grown over the past 12 years with each division contributing different growth as can be seen from the chart below.
- By 2020, the Manufacturing division revenue had shrunk to 18 % of the Group’s revenue compared to 43 % in 2012. This division's revenue had been growing until 2017/18 when it lost a major supply contract.
- The revenue for the other 3 divisions has grown so that by 2023 they seemed to have about similar contribution to the Group’s revenue.
 |
| Chart 4: Segment Revenue |
In terms of regional contribution:
- The Indonesian operation is mainly from the oil palm plantation while Papua New Guinea’s main operation is fish canning. The Malaysian operations cover 4 business segments.
- The Malaysian operations had not shown any revenue growth from 2012 to 2023. The growth of the bulking and plantation operations made up for the loss of the manufacturing business.
- For the same period, revenue from Papua New Guinea grew at 6.5 % CAGR while that for Indonesia was 3.0 % CAGR.
 |
| Chart 5: Revenue by Regions |
Each division’s profits were driven by different factors as they operated in different sectors of the economy.
- The Manufacturing division's profit is today smaller than that a decade ago due to the loss of a major supply contract.
- The Plantation revenue is dependent on the planted acreage as well as the palm oil prices. The Group had about 7.3 hectares of planted oil palm in 2012. This grew to 15.0 hectares by 2023. KFIMA's plantation business is relatively small. Its planted area is less than 1 % of the total planted areas of the top 3 plantation groups in Malaysia (Sime, KLK, and IOI).
- The Food division has been the smaller EBIT contributor over the past few years.
- The revenue growth in the Bulking business came from added storage capacity. But as can be seen from the chart below, the EBIT contributions have grown over the past 2 years.
 |
| Chart 6: Segment EBIT |
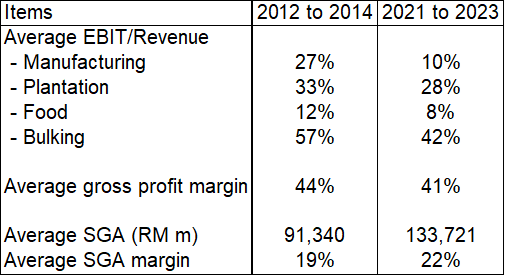
Over the past 12 years, while the Group’s revenue has grown, the profits have declined. Excluding the 2 extraordinary events (Indonesia land title issue and the loss of a supply contract), the declining profits were due to:
- A decline in the gross profit margins.
- An increase in the Selling, General, and Admin expenses both in terms of dollar terms as well as % of the revenue
 |
| Table 1: Comparative performance |
1H 2023 (First half FYE 2024)
The revenue and PAT for the first six months ended Sep 2023 was about 20 % and 26 % respectively lower than that for the same period last year.
According to the Group, the lower revenue was attributed to the decrease in revenue generated by the manufacturing, plantation, and food divisions. This in turn resulted in lower PAT.
I am a long-term value investor and I consider quarterly performance as “noisy”. As such I focus on long-term trends.
Competitive profile
KFIMA with its 4 business segments is unique as there are no other Bursa Malaysian companies with similar business profiles.
Secondly, in terms of TCE, the Plantation division is the largest segment accounting for almost 1/3 of the Group TCE in 2023.
However, I do not think that we should use the Plantation companies as the benchmark. I have mentioned that KFIMA planted areas are less the 1 % of the respective planted areas of the top 3 plantation companies in Malaysia.
As such, I have selected as peers those companies with:
- About similar hectares of planted oil palms as KFIMA.
- Sizeable non-plantation businesses.
The table below shows the profile of KFIMA and the peers comprising
- CB Industrial Product Holding Bhd (CBIP).
- MKH Bhd (MKH).
- Subur Tiasa Holdings Bhd (Subur Tiasa).
Chart 7 shows the revenue and ROE trends of the peers compared to KFIMA. Table 3 summarizes the comparative growth rates and average ROE over the past 11 years.
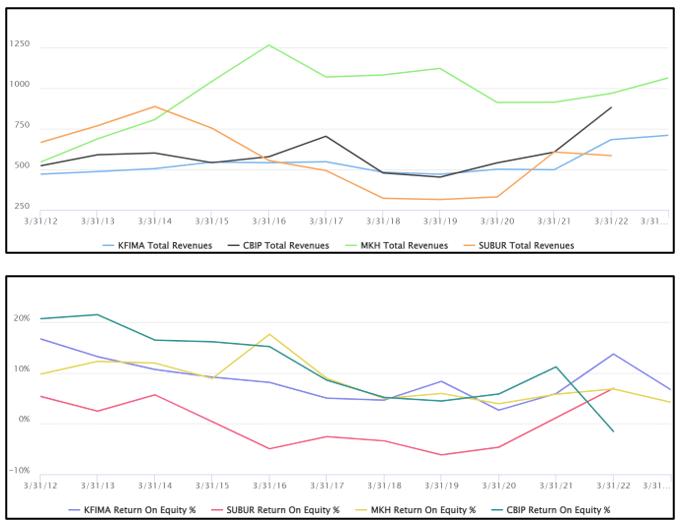 |
| Chart 7: Peer Comparison |
I would rate KFIMA performance as average based on these 2 metrics.
- In terms of revenue growth, KFIMA ranked 3rd among the 4 companies. It lost to CBIP and MKH. But note that these 2 companies had bigger revenue from different sectors. In other words, the respective revenue growth could be because of different sector growth rates. Hence, I would not draw too many conclusions about KFIMA's revenue performance.
- In terms of ROE, all companies except MKH experienced declining ROE in the first half of the past 12 years. But on an overall average basis, KFIMA did well as can be seen from Table 3.
 |
| Table 3: Peer performance |
Financial position
I would rate KFIMA as financially sound based on the following reasons:
- As of Sep 2023, the Group has RM 301 million in cash and securities. This is about 18 % of the total assets.
- As of Sept 2023, the Group had a debt-equity ratio of 0.26. While low, it is the past 12 years high. Its lowest debt-equity ratio was in 2014 at 0.01. The increase was due to the lease liabilities for the leasehold land.
- Over the past 12 years, the Group has generated positive cash flow from operations every year. Cumulatively it generated about RM 1.2 billion of cash compared to the RM 1.0 billion PAT. It is a reasonable cash conversion ratio.
- The Group had a good capital allocation plan as shown in Table 4. Over the past 12 years, the cash flow from operations was invested to grow the business (CAPEX and acquisitions) as well as pay dividends.
- The Group has an average 26% reinvestment rate. Reinvestment = CAPEX + Acquisitions – Depreciation + Changes in Net Working Capital. This meant that only 26% of the after-tax operating profit needed to be reinvested to grow the business. The balance of 74 % of free cash flow can be returned to shareholders.
 |
| Table 4: Sources and Uses of Funds 2012 to 2023 |
Shareholders’ value creation
I looked at the following metrics when assessing shareholders’ value creation:
- Comparing returns with the cost of funds.
- Comparing the gains by an investor who bought a share at the end of 2012 with the cost of equity.
- Looking at the Q Rating which is based on several valuation metrics. A high score relative to the panel meant that the company had the potential to create shareholders’ value.
I would assess KFIMA as good in terms of creating shareholders' value from a business perspective as it did better than the cost of funds for the first 2 metrics in Table 5. It failed on the last metric. But this is because of the poor market sentiments.
 |
| Table 6. Computing the shareholders’ gain |
At the same time, KFIMA had an overall Q Rating of 0.44. This places it at the average position among the panel companies. On the negative side, the Q Rating had decreased from 0.47 in 2022 due to a lower score for low risk.
 |
| Chart 8: Q Rating |
|
Risks
I normally look at 2 categories of risks - investment risks and business risks. In most of my Bursa Malaysia case studies, the main investment risk is privatization risk.
However, for KFIMA, I do not expect this to be a major risk. Firstly, if there was any plan to privatize the Group, it would have been better to do so in mid-2020 when the price was around RM 1.20 per share.
At the current market price, it does not make economic sense to privatize it. I do not see this as an investment risk.
However, in the context of a value trap, there are 2 business risks to consider:
- The Manufacturing division transport document business.
- The Indonesian plantation land title issue.
I have also invested in KFIMA so you should treat my analysis as a potential bias risk.
Manufacturing
The Group's main manufacturing arm was originally the Malaysian government printing operations. It printed many of the government’s security and confidential documents such as passports.
It was privatized and became part of KFIMA which then continued with the government printing business.
In 2016/17, the supply contract for travel documents expired and the Group lost the tender to a more tech-oriented proposal. The result was a large drop in revenue.
KFIMA lost the travel document contract after being the supplier for more than 20 years. It lost the 5 years contract to a party that pitched a “digital tech” solution. In other words, digital tech has provided competitors with an entry point. KFIMA's long supply history may not be enough to provide a barrier to entry for the travel document supply.
KFIMA has stated that it has now upgraded its digital technology capabilities. However, the Group has not been able to make any significant headway in selling these "digital" products to the neighboring countries. It does illustrate that it is not easy to supply to any government largely.
The Group only provided a breakdown of the various product categories from 2017 to 2022. It would seem that the biggest contributor today is from the transport product category.
The Group has not stated the number of contracts that are associated with this business. There may be one or two major contracts. If so, then this is a business risk. As the loss of the travel document supply contract has shown, there would be much lobbying for the transport document supply.
The Group said that it would adapt the business to be a multi-platform one as well as expand to the nearby geographies. But, the Group has not been able to find a replacement business on the same scale. So the Manufacturing division revenue has plateaued over the past 5 years.
The Manufacturing division's historical performance was due to its government printing legacy. I am not sure whether it can win back the travel document business. The real challenge is whether it would also lose the transport business. As such I would not project a bright future for this division.
On a positive note, if the division can maintain its current position, it will still contribute to the Group's bottom line.
Plantation
From 2012 to 2023, the division's revenue doubled. The Plantation division is now focused on palm oil. In 2023, the pineapple plantation accounted for less than 2 % of the segment revenue.
KFIMA Plantation division is a small operation in the context of the Malaysian oil palm plantation industry.
Palm oil is a global commodity with cyclical demand. Malaysia is the second-largest palm oil producer and exporter globally. Malaysia has 32.6 % of the international palm oil industry market share. However, the export volume has been dropping over the past few years due to the European Union's concerns over sustainability.
But the industry does not look like it is a sunset one. Firstly, the industry is moving towards a sustainable model although it looks like a long road ahead.
Secondly, palm oil is relatively cheap because it is something of a wonder crop. It grows relatively quickly, is easy to harvest, and is productive.
“A hectare of oil palm can reliably produce four tonnes of vegetable oil every year, compared to 0.67 tonnes for rapeseed, 0.48 tonnes for sunflowers, and just 0.38 tonnes for soybeans. Under ideal conditions, high-yield oil palm cultivars can produce more than 25 times as much oil as soy can for the same area of farmland”. BBC
Based on the above, there are still growth opportunities for the Plantation division. But I think this will have to come from new plantation land as the existing plantation land has been well utilized.
- The Group currently has 185 hectares planted with pineapple that could be repurposed for palm oil. This is a small acreage.
- The is probably only a small increase in % of the land area planted. As of 2023, about 81% of the available land has been planted.
- There is unlikely to be growth from more mature palms. In 2023, the mature areas accounted for 91 % of the total planted areas.
- It is possible to get some growth from improved productivity - higher FFB (free fruit branches) yield and higher oil extraction rates.
A profile of how the division has grown over the past 12 years can be seen in the table below.
 |
| Table 7: Plantation statistics |
Indonesian Plantation legal case
The Group has an 80% subsidiary PT Nunukan Jaya Lestari (PTNJL) that owned about 19,900 hectares of land in Kalimantan, Indonesia in 2023. Note that this acreage was based on the information provided under the list of properties in the 2023 Annual Report.
- This is the Group's only plantation operation in Indonesia.
- In 2023, this Indonesian operation accounted for about 2/3 of the total fresh fruit branches of the Group.
There is currently a dispute with the Indonesian authority over the actual acreage owned by the Group. The dispute is over 2 parcels:
- 17,765 hectares that overlapped with some forest areas.
- 3,500 hectares that overlapped with another 3rd party right to use the land.
There is an outstanding legal suit that was started in 2016 and has gone through several judicial levels.
There have been several swing judgments. There was a point when it looked as if KFIMA had lost all the disputed land. There was then a subsequent judgment that KFIMA had the rights to all the areas except for the 3,500 hectares that overlapped with the 3rd party. At one point it seemed that KFIMA only had the right to 2,809 hectares of land.
In its 2021 Annual Report, KFIMA stated that it had “…ceased operations in the disputed/overlapping area measuring approximately 800 hectares.”
In its 2023 Annual Report, KFIMA reported:
“PTNJL continues to operate its plantation activities premised on its current operating license pending issuance of the fresh one. Meanwhile, the HGU land title application in respect of the non-disputed areas is ongoing to date.”
Pending the resolution of the dispute, the local authorities have allowed KFIMA to continue with its plantation operations.
Looking at Table 7, I would surmise the following
- The Group plantation land bank in 2023 had taken into account the various legal decisions. This reduced the available land for the Group from 30,412 hectares in 2020 to 18,596 hectares. You will note that the 18,887 hectares are less than the 19,900 hectares owned by PTNJL as stated in the list of properties.
- 36% of the Group planted areas or 5,382 hectares are in Indonesia. This appears to be partly in the disputed areas.
I would point out that since KFIMA has made the appropriate provisions, there is unlikely to be an impairment to the PPE. In other words, the Asset value is realistic.
Secondly, I would not expect an expansion of planted acreage from PTNJL.
Food
The Food division has two segments:
- Manufacturing and distribution of canned and frozen fish in Papua New Guinea (PNG). This accounted for 97 % of the Food division revenue in 2023.
- Trading of food products and contract packing services of powdered beverages and condiments. These were mainly carried out in Malaysia.
I estimated that the Food division revenue growth appears to be driven by the PNG operations. Revenue from PNG doubled from RM 90.1 million in 2012 to RM 186.1 million in 2023.
According to the National Fisheries Authority of PNG, the fisheries potential of PNG is yet to be realized.
- Tuna is the largest PNG fishery. The catch from PNG waters accounts for 20 % to 30% of the regional catch and is about 10% of the global catch.
- Export value in 2021 was doubled in 1999.
But as shown earlier, this is a low-margin business. While there are prospects for export growth from PNG, I would not expect double-digit growth in revenue or profits from the Food division.
Bulking
From 2012 to 2023, the Bulking division has managed to double its revenue by growing at a CAGR of 10.2 %. The bulk of the growth came over the past 2 years.
This reflects significant progress toward KFIMA's strategic objectives to be a fully integrated logistics provider for liquid products.
But the average EBIT margins in 2012/13 of 56% had declined to 38 % in 2022/23. This was probably the result of changes in product mix and rental rates.
This is mainly a storage business where revenue growth is constrained by storage capacity. The Group currently has 259 tanks with 412,865 cm of storage capacity.
Long-term growth would depend on capacity expansion. In the past KFIMA had expanded through acquisitions as well as the construction of new storage tanks. For example:
- In 2009, the Group bought out the minority interest in one of its joint ventures.
- New storage tanks with 13,000 MT capacity were added in 2013.
- In 2023, new tanks with a storage capacity of 30,460 cm were completed.
- The Group anticipates completion of an additional capacity of 33,860 cbm in Q2 of FYE 2024 and 52,590 cbm in Q4 of FY2024.
My investment
To be transparent, I have invested in KFIMA so you should treat this as one possible risk from my biased perspective.
I bought the shares in KFima in 2014/15 at an average price of RM 2.23 per share as I found that it was a fundamentally strong Group. It had an overall Q Rating of 0.80 then.
At that juncture, the Group’s NTA was RM 2.29 per share and it had an EPV of RM 3.19 per share. I could not see any reason why the market was underpricing the Group. As such, I had classified it as a Quality Value investment.
I had expected the market to re-rate it within a few years. Unfortunately, the price began to decline after I had bought it. It did not help that the Group encountered the land title dispute and the loss of a major supply contract.
I have not sold any of KFima shares since my purchase. Over the past 8.34 years (till the end Dec 2022), I have received on average about RM 0.87 of dividends per share. The result is that my total return is about 2.9 % per annum on a compounded basis. Refer to Table 8 for the computation.
 |
| Table 8: My Investment Return |
Valuation
There was hardly any revenue growth over the past 12 years as the Group lost a lucrative travel contract. The Group had to rebuild the revenue by growing the revenue from the other business segments. It had managed to achieve this.
My investment thesis is that KFIMA has a turnaround and its Earnings-based value would depend on how you see the turnaround play out.
In this context, I took a conservative approach and valued it based on its Earnings Power Value. In other words, I ignored growth.
At the same time, KFIMA has understated investment properties amounting to RM 18 million. I have also ignored this in my Asset Value.
Chart 14 illustrates the valuation of KFIMA. At the market price of RM 1.82 per share (as of 4 Dec 2023) there is more than a 30 % margin of safety for both Asset Value and EPV.
- The Asset Value is RM 3.33 per share.
- The EPV is RM 3.51 per share.
The cash and securities of the Group came to RM 1.41 per share. This means that the market is only ascribing about RM 0.41 for all the operations of KFIMA. This looks like a lot of undervaluation.
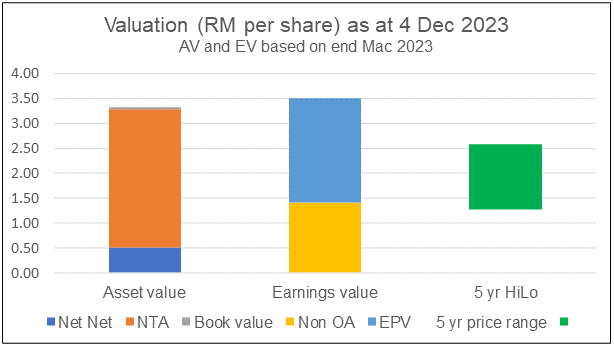 |
| Chart 9: Valuation |
Valuation model
My Earnings Power Value of the company was derived based on the average derived from 2 valuation methods:
- A single-stage Free Cash Flow to the Firm (FCFF) model as per Damodaran.
- The Residual income model as per Penman.
The cost of capital used in the model was based on the Capital Asset Pricing Model. I followed Damodaran’s approach to determine the Beta and the risk premiums.
KFIMA is one of the better Bursa stocks
My analysis of KFIMA showed that there was no growth in revenue over the past 12 years. But this was due to a loss of a major contract that was offset by growth in other businesses.
While it also had some land title disputes over the Indonesian plantation land, the Group had provided for this impairment. The Group has also built up a strong bulking business.
I would rate the Group as fundamentally sound.
- Its business returns were greater than the cost of funds.
- It has a low reinvestment rate.
- It is financially sound.
- Excluding the security manufacturing business, the other 3 segments are not sunset sectors. They have growth potential.
On top of these, there is more than a 30% margin of safety based on the Asset Value and Earnings Power Value.
Given these, I would conclude that KFIMA is not a value trap but one of the better Bursa companies to invest in.
During the past 12 years, on top of COVID-19, the Group experienced 2 extraordinary events:
- A land title dispute for its Indonesian plantation. There was a marked reduction in profit in 2017 due to the impairment of RM 29 million to cater for this.
- The 2018 results were affected by the loss of a major supply contract by the Manufacturing division.
I suspect that these caused the share price to decline. With these resolved, the market price recovered to reach a 12-year high in mid-2022. However, the market price has since declined to about the 2016/17 levels. Refer to Chart 10.
If you look at the fundamental analysis, the market price does not seem to reflect a better business position.
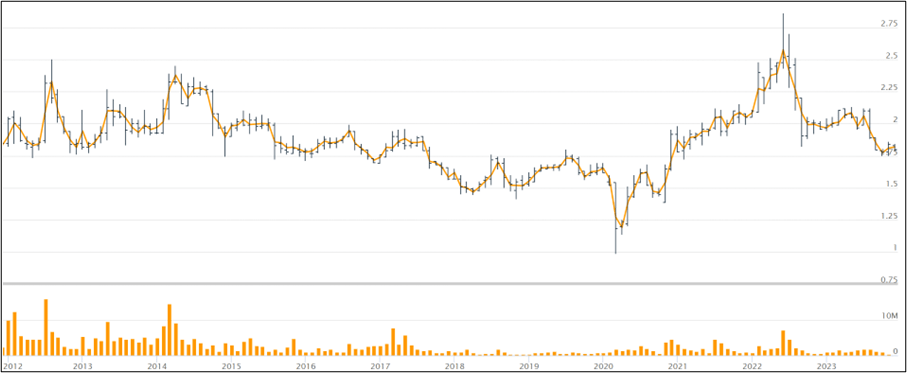 |
| Chart 10: Market price |
End
- - - - - - - - - - - - - - - - - - - - - - - - - - - - - - - - -
How to be an Authoritative Source, Share This Post
|
Disclaimer & Disclosure
I am not an investment adviser, security analyst, or stockbroker. The contents are meant for educational purposes and should not be taken as any recommendation to purchase or dispose of shares in the featured companies. Investments or strategies mentioned on this website may not be suitable for you and you should have your own independent decision regarding them.
The opinions expressed here are based on information I consider reliable but I do not warrant its completeness or accuracy and should not be relied on as such.
I may have equity interests in some of the companies featured.
This blog is reader-supported. When you buy through links in the post, the blog will earn a small commission. The payment comes from the retailer and not from you.


Comments
Post a Comment