Will Parkson Holdings turn out to be a dud?
Value Investing Case Study 12-5. Parkson Holdings: A retail revival or a risky bet? An updated fundamental analysis of Parkson Holdings based on the Annual Reports till 2022. I wanted to see whether it could turn around and deliver shareholders’ value.
I first wrote about Parkson Holdings Bhd (PHB or PHB Group) in March 2021. It was then trading at RM 0.22 per share compared to its Book Value of RM 1.53 per share (as of the end of Dec 2020).
The market price has since increased to RM 0.31 per share (as of 13 Nov 2023) while the Book Value has declined to RM 1.28 per share (as of the end of Jun 2013). The decline in the Book Value showed that PHB had incurred losses since then.
To be transparent I own PHB shares at an average price of RM 0.80 per share. I have been holding them for about 7 years.
In the article “Parkson Holdings - how to handle a price decline” published in Jun 2022, I provided my rationale on why I continue to hold the shares. In that article, I provided a framework on how to analyze an investment when you face a price drop.
In this article, I will provide an updated fundamental analysis and valuation of PHB. Where relevant I have also incorporated some of the analysis from my earlier articles. If you had tried to access my previous articles, you would have been redirected here.
Join me to see why I do not think that PHB will turn out to be a dud.
Should you go and buy it? Well, read my Disclaimer.
Contents
- Investment thesis
- Rationale
- Business background
- Operating trend
- Financial position
- Risks
- Valuation
- PHB is not a dud
|
Investment Thesis
Over the past 8 years, PHB incurred losses. This was initially due to the digital disruption the PHB Group experienced in China. PHB had to re-invent itself with its “omni-channel” strategy. But before it could benefit from this, came Covid-19.
With Covid-19 now behind us, there is an opportunity for PHB to return to profitability. PHB still has a strong store presence in China and Malaysia.
The key challenge is the high-interest expense. However, this is a business that had a negative cash conversion cycle. At the same time, despite its losses, PHB had a good track record of generating cash flow from operations. This should mitigate the high-interest expenses.
There is also a very good margin of safety from the Asset Value. My conservative estimate of its Earnings Power Value also provided a sufficient margin of safety.
|
Rationale
- The department store industry in China and Malaysia is not yet a sunset one. There are revenue growth trends among the key players in these countries.
- In China, PHB addressed the digital challenge by going into mall ownership and adopting an Omni-channel strategy. China accounted for about ¾ of the PHB Group revenue so any turnaround here will have a significant impact.
- The Malaysia operations seem to have returned to profitability.
- PHB has a good cash-generating track record. The key challenge is the high-interest expense. But higher earnings would mitigate this.
- The Group has a good capital allocation track record. But I would rate its track record for creating shareholders' value as poor.
- There are good margins of safety based on the Asset Value and EPV.
The supporting details are presented in the following sections.
|
Business background
PHB is part of the Lion Group of Malaysia which was established in the 1930s. The Lion Group is today involved in the retail, property development, mining, steel, agriculture, and computer sectors in many ASEAN countries, China, and the USA.
PHB was formerly in the steel fabrication business. It assumed its present name in 2007 when it divested its steel fabrication business. It then acquired a strategic stake in some retail assets in China, Malaysia, and Vietnam from another member of the Lion Group.
PHB's business model comprises a blend of concessionaire sales, anchor tenants, customized product mix, and state-of-the-art management tools.
There are currently 3 listed entities within the PHB Group as shown in the chart below.
 |
Chart 1: Corporate structure |
- Parkson Retail Asia Ltd (PRA) was listed on SGX in 2011. It is the leading Southeast Asian department store retailer with 39 department stores in Malaysia and 1 in Vietnam as of Dec 2022.
- Parkson Retail Group Ltd (PRGL) which made its debut listing on HKEX in 2005, is one of the premier retail operators in China. The PRGL Group has 42 stores in China.
- PHB Group is the holding company for PRA, PRGL, and other subsidiaries which are not under PRA or PRGL.
In 2022, PRGL accounted for about 72 % of the PHB Group revenue while PRA accounted for 26 %.
|
The Lion Group retailing business had its roots in 1987 when it acquired the net assets of selected stores of Emporium Holdings Bhd. It then began to establish many department stores under the Parkson brand.
Parkson Malaysia spearheaded the Lion Group retailing business. It established itself as a diversified retail chain with different retail formats catering to different market segments. By the time of its acquisition by PHB in 2007, Parkson Malaysia had a total of 30 department stores in Malaysia and 3 department stores in Vietnam.
The Parkson brand was introduced to China with the opening of the Parkson department store in Beijing in 1994. PRGL which was set up to operate the Parkson department store in China, had 40 stores in 27 cities in China under its wing by the time it was acquired by PHB.
Over the past 14 years, China and Malaysia retail stores accounted for the majority of the PHB Group sales. This is despite operating in few other countries as can be seen from Chart 2.
- The PHB Group closed its Myanmar retail store in 2018 after being in the country since 2013.
- The PHB Group was in Sri Lanka in 2013 and 2014 via a listed associate. It is no longer there.
- The PHB Group ceased to have control over the subsidiary in Indonesia in 2021.
 |
| Chart 2: Revenue by Country |
While the PHB Group revenue has shown a growth trend since 2009, it hid the fact that same-store sales have been declining as per the chart below. This reflected the challenging environment.
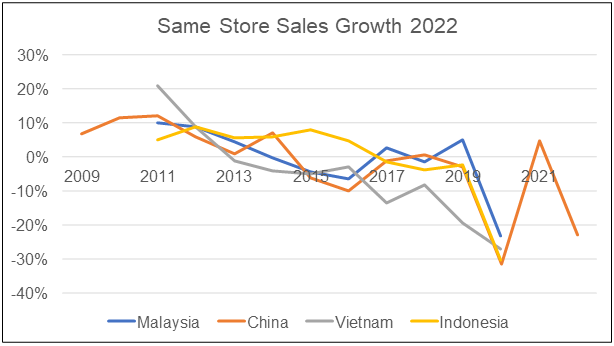 |
| Chart 3: Same Store Sales Note: The Group did not report the same-store sales for 2021 and 2022 for Malaysia and Vietnam. |
Throughout the past 14 years, the PHB Group has expanded beyond its department store business. It went into mall ownership, provision of credit lines, and F&B. But, the contributions from these are still not substantial.
- In its 2014 Annual Report, RPGL stated that it will focus on an Omni-channel strategy. This is a combination of online and offline business. It also operated several different retail formats. These included shopping malls, department stores with lifestyle elements, specialty stores as well as fashion outlets.
- In 2016, PRA ventured into the lifestyle retail concept. The department store operations had elements of entertainment and food and beverages. It has also introduced private label brands as well as agency lines of numerous international brands.
Yet, the sales of goods and concessionaire commissions still accounted for 89 % of the PHB Group revenue in 2022 down from 95 % in 2009. Direct sales of goods have become larger than concessionaire commissions. Refer to Chart 4.
The only other area that seemed to have a significant contribution is rental with the 2022 rental income being more than doubled that of 2009.
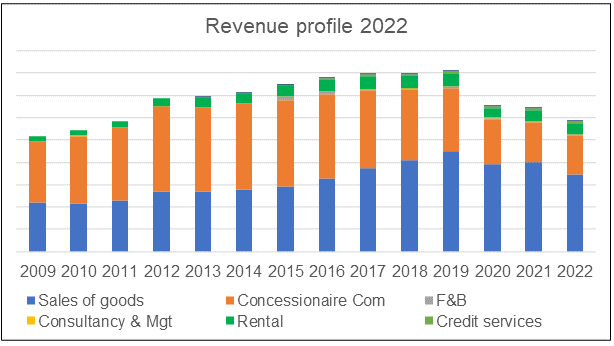 |
| Chart 4: Revenue Profile |
Apart from managing a diversified collection of retail formats, the PHB Group has also become a significant property owner. From 2009 to 2022, the value of the Investment Properties of the PHB Group grew from RM 32 million to RM 452 million.
However, the fair value of the Investment Properties as of Dec 2022 was RM 2.1 billion rather than the RM 452 million recognized in the Balance Sheet. There is a substantial “hidden” value.
Operating trends
I looked at 3 metrics to get an overview of the overall performance – revenue, PAT, and gross profitability (gross profits / total assets). Refer to Chart 5.
- Revenue peaked in 2019 and declined thereafter. I suspect this was due to the Covid-19 pandemic. Over the past 14 years, revenue grew at only 1.0 % CAGR.
- PAT showed a declining trend with losses from 2015 onwards.
- Gross profitability seemed to hold steady until 2020 when it dropped by about 40%.
If nothing else, the chart showed that PHB faced a challenging past 14 years. One of the key challenges was the heavy interest burden as exemplified by the following.
From 2009 to 2022, PHB achieved an average annual operating profit of RM 276 million. Over the same period, it incurred an average annual interest expense of RM 187 million.
 |
| Chart 5: Performance Index |
Apart from the lower gross profits, the profits were affected by some high one-off expenses. To give you a sense of this, I have listed some of the key expenses of the 2 listed subsidiaries in the following section.
PRGL expenses
You can infer a loss in Chart 6 when the gross profit is at the same level or lower than the total expenses.
- In 2015 there was a one-off litigation loss of RMB 140.9 million.
- The profit in 2016 was due to a one-off gain of RMB 1,282.9 million. This more than offset the one-off impairment of RMB 402.0 million.
- The loss in 2017 was due to a one-off litigation loss of RMB 136.0 million and an impairment in associates and goodwill of RMB 18.4 million.
- In 2018, although RPGL had a positive PBT of RMB 125.8 million there was a loss after tax. The tax was higher than the statutory rate because there were tax losses not recognized as well as expenses not deductible for taxes.
- In 2019, although RPGL reported an EBIT of RMB 538.9 million there was a loss after interest due to the adoption of IFRS 16. This resulted in an interest charge of RMB 425 million on the lease liability. Note that under IFRS, the rental was reduced and replaced with additional depreciation expenses.
- The drop in revenue from 2020 to 2022 that led to losses was due to the measures taken in China to control Covid-19.
 |
| Chart 6: PRGL Expenses |
PRA expenses
Chart 7 shows the gross profit in 2021 and 2022 being higher than the total expenses. These are indications of PRA returning to profitability.
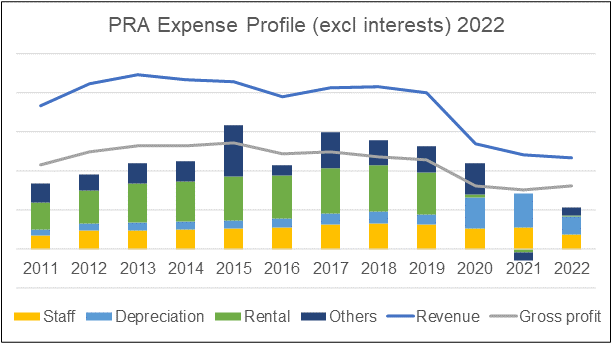 |
| Chart 7: PRA Expenses |
From 2015 onwards, the lower revenue due to the challenging market condition led to lower gross profits. Together with the higher expenses, it meant that PRA incurred losses for many years.
- In 2015, there was a one-off provision of SGD 64.7 million for the early termination of a store lease in Hanoi.
- In 2016, there was a one-off gain of SGD 46.8 million due to the disposal of a subsidiary that led to profits for the year.
- In 2017 there was an impairment charge of SGD 26.1 million.
- In 2018, there was an impairment of SGD 12.3 million although this was partly offset by an impairment reversal of SGD 9.7 million.
- In 2019, there was an impairment and contract provision of SGD 17.1 million although this was partly offset by an impairment reversal of SGD 3.1 million.
- In 2020, apart from the lower revenue due to the Covid-19 pandemic, the adoption of IFRS 16 resulted in an additional expense of SGD 38.2 million.
- The profit in 2021 was after accounting for the deconsolidation of a subsidiary in Indonesia, and income from the Vietnam sub-leasing.
DuPont Analysis
Because of the high-interest expenses, it is more meaningful to look at the returns on an after-tax operating profit basis.
I defined the operating return as [Op Profit(1-t)] / TCE where:
TCE = Total capital employed = Equity + Debt – Cash
The equivalent DuPont analysis is then
Return = Op margin X Asset turnover X Leverage
Op margin = Op profit(1-t) / Revenue
Asset turnover = Revenue / Total assets
Leverage = Total assets / TCE
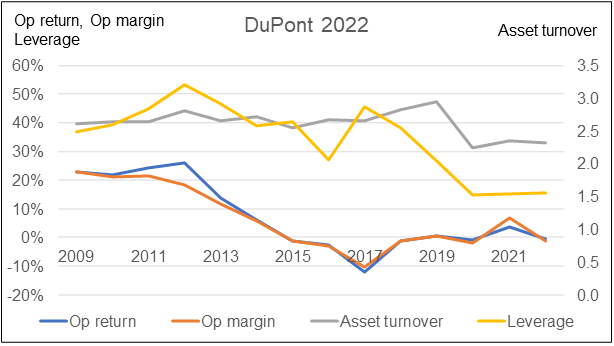 |
| Chart 8: DuPont Analysis |
You can see from Chart 8 that the Op return declined over the past 14 years in line with the declining PAT. A DuPont analysis showed that the bulk of the declining ROE can be linked to the declining Op margin. Leverage also showed a declining trend from 2012.
IH 2023
The revenue for the first six months of 2023 was about 8 % higher than that for the same period last year.
But in the first six months of 2023, PHB generated RM 80 million PAT compared to a loss of RM 74 million for the same period last year. The improved profit was due to the better performance from China.
I am a long-term value investor and I consider quarterly performance as “noisy”. As such I focus on long-term trends. Nevertheless, the half-year results do point to some turnaround.
Competitive profile
Since the PHB Group is unique in its presence in both China and Malaysia, I have separated the peer comparisons by country.
China Peers.
PRGL's (ref 3368) peers are some of the major department store companies listed on HKEX or China as per the Disfold list.
- Beijing Hualian Dept Store (ref 000882)
- Dashang Company (ref 600694)
- Shanghai Bailian Group (ref 600827)
- Shanghai Yuyuan Tourist Mart (ref 600655)
- Yonghui Superstore Company (ref 601933)
- Wangfuijing Group (ref 600859)
 |
| Chart 9: PRGL Peer comparisons |
From the China perspective, PGRL was not among the top performers in terms of revenue and ROE as can be seen from Chart 9.
Looking at the peer revenue from 2009 to 2019, it suggests that the Chinese department store companies seemed to have countered the digital disruption.
Malaysian Peers
As Malaysia accounted for the bulk of PRA’s (ref O9E) revenue, it makes sense to compare its performance with those of the Bursa retailers.
- Aeon
- Kamdar
- Malaysian United Industries (a proxy for Metro Jaya)
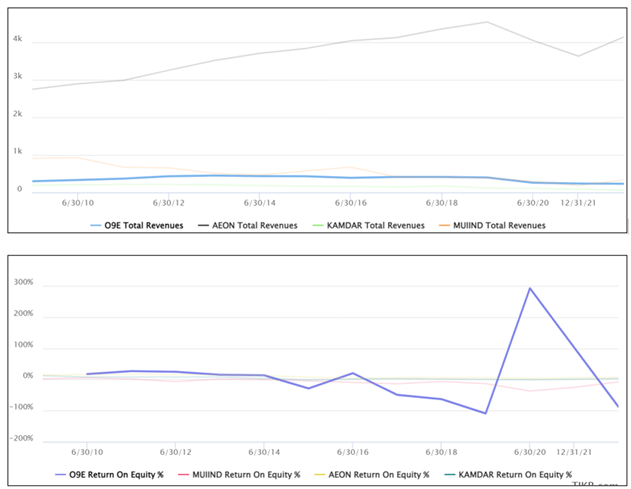 |
| Chart 10: PRA Peer Comparisons Note: The high ROE for PRA in 2020 was because there was a loss as well as a loss of negative equity resulting in an arithmetically high ROE. |
As for Malaysia, PRA lost out to Aeon in terms of revenue size but it did better than its other peers. But when it came to ROE, PRA only performed better than its peers before 2014. Thereafter, except for 2020, its ROE was worse than those of its peers.
The key takeaway is that looking at the revenue trends for both China and Malaysia, I would conclude that this is not a sunset industry.
Financial position
The key concern here is the high-interest rate.
- In 2022, there was only a 2.0 EBITDA / interest expense ratio.
- PHB had a debt-equity ratio of 185 % as of Jun 2023. This is about the highest level over the past 14 years probably due to the low equity.
But there are other positives for PHB.
- It has a negative cash conversion cycle. The creditors are effectively funding its operations.
- As of the end of Jun 2023, it had RM 1.5 billion cash and short-term securities. This was equivalent to 17 % of its total assets.
- Over the past 14 years, there was only one year where it did not manage to generate positive cash flow from operations.
- Over the past 14 years, it generated RM 6.5 billion cash from the cash flow from operations compared to RM 1.7 billion of PAT. This is a very good cash conversion ratio.
The PHB Group also had a reasonable capital allocation track record as shown in Table 1. You can see that its cash flow from operations was well deployed for CAPEX and dividends. Debt was also reduced from the sale of assets and securities.
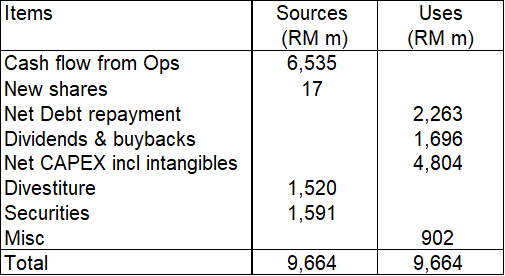 |
| Table 1: 2012 to 2022 Sources and Uses of Funds |
Shareholders’ value creation
I looked at the following metrics when assessing shareholders’ value creation:
- Comparing returns with the cost of funds.
- Comparing the gains by an investor who bought a share at the end of 2011 with the cost of equity.
- Looking at the Q Rating which is based on several valuation metrics. A high score relative to the panel meant that the company had the potential to create shareholders’ value.
I would assess PHB as poor in terms of creating shareholders' value as it failed on all metrics as can be seen from Table 2.
 |
| Table 3. Estimating the shareholders’ gain |
At the same time, PHB had an overall Q Rating of 0.45. This places it at the average position among the panel companies. On the positive side, the Q Rating had improved from 0.39 in 2021.
 |
| Chart 11: Q Rating |
Risks
I look at risks through the following lenses:
- Privatization.
- Digital disruption.
Privatization
The Chairman controls 55 % of PHB and it would cost him about RM 160 million to take it private at the current market price.
PHB does not have much cash at its company level to undertake privatization via a capital reduction plan as the bulk of the cash is at the PRGL level. The Chairman and/or the Lion Group has to seek funding for such an exercise.
I do not see the privatization of PHB as a key risk for the following reasons:
- The other businesses of the Lion Group - steel, and property - are also facing challenging times. I don’t see the controlling shareholder or the Lion Group using up the cash to privatize PHB.
- If there was any interest in taking it private for relisting later, it would have been done when the share price was very much lower.
- Given the revaluation surplus, I do not see any minority shareholders voting for privatization at the current market price.
At the same time, I do not see the possibility of taking PRA private. Under SGX guidelines, any privatization of PRA has to be at a fair price. I read this as an offer price being close to the Book Value or NTA. There is no financial reason to take PRA private based on such a price.
But PRGL is a slightly different story.
Given the current market price and 55 % ownership, it would cost PHB about RMB 154 million to take PRGL private. Compare this with the RMB 1.7 billion cash and securities held by PRGL.
HKEX does not have “fair value” guidelines. PRGL can be privatized by a scheme of arrangements - this could be capital reduction based on PRGL's funds.
Would PHB pursue this? I can think of some roadblocks to the privatization of PRGL.
- In the past PRGL has issued bonds which were then listed. PRGL would probably not want to lose this funding option given the expansion potential of China.
- While PRGL has RMB 1.7 billion in cash and securities, it also has RMB 2.6 billion in debt (excluding leases). I am not sure that it is prudent to use up the cash for a privatization exercise given that PRGL still has expansion plans.
- Given the revaluation surplus, I do not see any minority shareholders voting for privatization at the current market price.
Digital disruption
We know that digital technology is disrupting the retail sector. How did PHB Group respond to this?
- In its 2014 Annual Report, Parkson Retail Group Ltd (PRGL) said that it will now focus on an Omni-channel strategy. PGRL said that there would be a combination of online and offline businesses, shopping malls, dept stores with lifestyle elements, specialty stores as well as fashion outlets.
- In its 2017 Annual Report, PGRL said that while “new retail” has brought a lot of challenges to the entire retail industry in China, PRGL sees ample opportunities and positive signs ahead with its new retail format.
- As for the other countries, in its 2016 Annual Report, Parkson Retail Asia Ltd (PRA) stated that the department store model is shifting towards a multi-dimensional model that seeks to create a more family-oriented experience.
While the progress of PHB was disrupted by Covid-19, there are other challenges in meeting the digital challenge. This is aptly summarized by McKinsey & Company.
In its paper “2022 China Retail Digitalization Whitepaper” they opined the following”
“Over the past decade, China’s retail industry has weathered seismic disruptions …Mobile commerce has surged, spurring the rise of the ‘new retail’ concept that blends offline and digital commerce… China’s Internet firms have stepped into retail and now vie for market share against offline incumbents.
…But a narrow emphasis on omni-channel expansion has succeeded only in depressing retail profits without achieving significant earnings growth...
…despite significant investment in omnichannel expansion, retailers are struggling to turn a strategic focus on digital into improved financial performance…”
The paper suggests that there is still a lot of work before the traditional department stores can overcome the digital challenge.
The good news is that the department store industry in China is not a sunset industry like what happened in the US. In Malaysia, the performance of Aeon suggests that this is also not a sunset sector.
According to Ibis World, revenue for department stores and shopping malls in China is expected to grow at an annualized 1.9% over the five years through 2023, including an expected 3.3% rise in 2023 when profitability is set to reach 5.0%.
Chart 12 shows that there has been growth in the number of department stores over the past few years. There is no sign yet of a collapse of the department store sector.
 |
| Chart 12: Number of Department stores in China. Source: Statista |
Valuation
PHB's performance over the past 14 years, especially its China operations, was affected initially by digital disruption and subsequently by Covid-19.
PHB had to re-invent itself to meet the digital challenge. The first half of 2023 performance in China suggests that there is light at the end of the tunnel. It is now a question of rebuilding its business.
At the same time, the Malaysian business seems to have also recovered from the measures taken to control Covid-19.
Chart 13 supports my contention.
 |
| Chart 13: Sales per outlet |
My investment thesis is that PHB is undergoing a turnaround and its Earnings-based value would depend on how you see the turnaround play out.
In this context, I assumed that it would take about 5 years for PHB to regain the average 2011 to 2013 level of profits. On such a basis, I estimate the EPV to be RM 0.96 per share.
At the same time, PHB has understated investment properties. In estimating the Asset Value, I assumed that since the properties are held by its 55% PRGL, we should only account for 55% of the revaluation surplus. Along this line, I estimated the PHB Asset Value to be RM 2.08 per share.
Chart 14 illustrates the valuation of PHB. You can see that at the market price of RM 0.31 per share, there is more than a 30% margin of safety under both the Asset Value and Earnings Value.
 |
| Chart 14: Valuation of PHB |
Valuation model
My Earnings Power Value of the company was derived based on a single-stage Free Cash Flow to the Firm (FCFF) model as per Damodaran.
Value of Firm = FCFF / WACC
WACC = weighted average cost of capital. The cost of capital used in the model was based on the Capital Asset Pricing Model. I followed Damodaran’s approach to determine the Beta and the risk premiums.
Value of Equity = Value of Firm + Cash – Total Debt – Minority interests
FCFF = EBIT(1-t)
t = tax rate. I assume a 24 % nominal tax rate.
The other assumptions used in my valuation are shown in Tables 4 and 5.
 |
| Table 4: Valuation assumptions |
I assumed that it would take PHB 5 years to go from its current operating profit to the steady stage profit. Refer to Table 5.
- The value of the operating profit in Year 1 of RM 119.6 million is the actual 2022 operating profit.
- The value for Yr 5 is the average 2011 to 2013 operating profit.
 |
| Table 5: Deriving the NPV |
Valuation risks and limitations
You should consider the following when looking at my valuation.
- Turnaround.
- Revaluation surplus.
The EPV is dependent on PHB turning around the business. If you do not agree that PHB can achieve this, you should not invest in PHB.
We can of course disagree on the level of profit that can be achieved. In my model, I have taken the 2011 to 2013 average where 2011 was the peak profits over the past 14 years. Note that the average value is 10% lower than the peak profit.
In my Asset Value, I have assumed that all the revaluation surplus of RM 0.80 per share can be achieved. In other words, I ignore the tax impact of this. I am not familiar with China’s property tax law but I think this is a bit optimistic.
In mitigation, I would state that I have not considered the value of the “Parkson” brand in my Asset Value.
Brand Finance ranked Parkson in the 54th position among the top 100 brands in Malaysia. I do not have access to the latest brand value. But in 2018, Brand Finance valued the “Parkson” brand at USD 308 million.
The other point about the Asset Value is that over the past 14 years, PHB had impaired assets. I would like to think that the current asset value is realistic and is not overvalued.
|
PHB is not a dud
My analysis of PHB showed that while it incurred losses over the past 8 years, this was due to initially the digital disruption in China followed by the COVID-19 measures.
PHB has re-invented itself in China and with Covid-19 behind us, it is in a good position to return to profitability. China accounted for about ¾ of the Group revenue so any turnaround here would have a significant impact on the Group's performance.
The department store sector is not yet a sunset industry in China and Malaysia as exemplified by the peers’ revenue growth.
Its key challenge is the high-interest expenses, but as it builds back its earnings, it should be able to reduce its debt.
Based on the above, I do not think that Parkson Holding is a dud.
End
- - - - - - - - - - - - - - - - - - - - - - - - - - - - - - - - -
How to be an Authoritative Source, Share This Post
|
Disclaimer & Disclosure
I am not an investment adviser, security analyst, or stockbroker. The contents are meant for educational purposes and should not be taken as any recommendation to purchase or dispose of shares in the featured companies. Investments or strategies mentioned on this website may not be suitable for you and you should have your own independent decision regarding them.
The opinions expressed here are based on information I consider reliable but I do not warrant its completeness or accuracy and should not be relied on as such.
I may have equity interests in some of the companies featured.
This blog is reader-supported. When you buy through links in the post, the blog will earn a small commission. The payment comes from the retailer and not from you.


Comments
Post a Comment