How the Malaysian plantation sector performed over the past 10 years
Case Notes 12. I originally wrote this article to cover 2013 to 2020. I have now updated this to 2022. It covered the performance of the companies under the Bursa Malaysia plantation sector. The data are meant to serve as base rates when analyzing plantation companies. Revision date: 10 Sep 2023
The palm oil sector is one of Malaysia’s primary industries. It makes up the largest share of its agricultural sector.
In 2021, the gross domestic product (GDP) contribution from palm oil in Malaysia was estimated to be at 2.5 percent of its GDP.
In mid-2021, there were 43 companies under the plantation sector of Bursa Malaysia. The majority of these are involved in the cultivation of oil palms.
I have a 3 minutes video on the plantation sector for those who want an overview.
Oil palm is essentially a commodity with cyclical prices as can be seen from the chart below. As such the fortunes of the plantation companies are also cyclical.
 |
| Chart 1: Palm oil prices Source: Trading Economic |
To assess the performance of individual plantation companies, you have to look at not only where the industry is in the current cycle. You also have to compare the company performance relative to the industry.
This is where base rates come in. This post summarizes the key performance metrics of the Bursa Malaysian plantation sector from 2013 to 2022.
Contents
- Sector summary
- Industry background
- Base rates
- How to use the base rates
- Methodology
|
Sector summary
The performance of the sector from 2013 to 2022 is summarized below. These were based on 41 companies under the Bursa Malaysia plantation sector.
The Shareholders’ Fund and Total Assets of the sector showed some growth over the past 2 years as can be seen from the chart below. The chart shows these metrics relative to their respective 2013 levels.
 |
| Chart 2: Sector size index |
The sector performance in terms of revenue, PAT and gross profitability seemed to have reached bottom in 2019. Since then, there were uptrends. The revenue in 2022 was 67 % higher than that in 2013. Refer to the Performance Index chart below.
 |
| Chart 3: Sector performance index |
In tandem with the PAT results, the sector ROE and ROA reached its bottom in 2019 and had since increased. The returns in 2022 are about 40% higher than those in 2013.
You should not be surprised as the 2022 price of palm oil was 57 % higher than that in 2013. As can be seen from the chart below, the returns show cyclical features.
 |
| Chart 4: Sector return index |
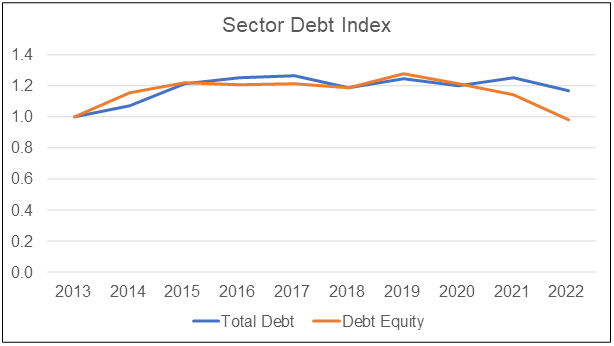
Over the past 10 years, the sector had an average Debt Equity ratio of 0.46. While the Total Debt in 2022 was higher than that in 2013, the Debt Equity ratio in 2022 was slightly below that of 2013.
 |
| Chart 5: Sector debt index |
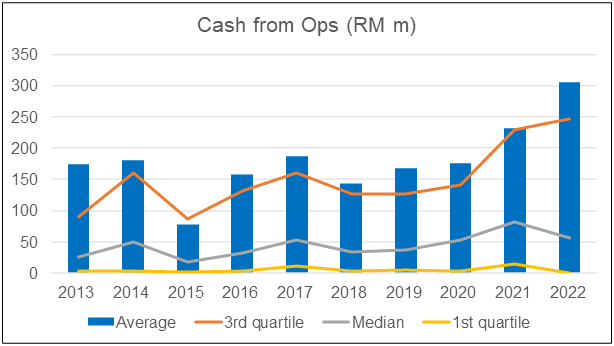
The sector had been able to generate positive Cash flow from Operations over the 10 years period despite a volatile PAT.
 |
| Chart 6: Sector cash flow from Ops |
|
Industry background
Palm oil is the world’s most used edible oil and is used in many consumer goods, as well as in biofuels. Malaysia is the second leading producer of palm oil worldwide, after Indonesia. Together, these two countries supply more than 80 percent of the world’s palm oil.
The European Union (EU) remains one of the largest markets for palm oil. However, the implementation of the European Green Deal could see restrictions on the use of palm oil. This is due to concerns about its environmental impact.
Malaysia has stepped up efforts to counter this negative perception. However, the sector has also started to shift its focus away from the EU to the Asian and African market. The larger export markets for Malaysian palm oil were China and India. Other important markets include the United States and Asia.
History
According to the Malaysia Oil Palm Council, the oil palm (Elaeisguineensis) originated from West Africa. There it grew in the wild in the tropical rainforest of the region.
A brief history of the palm oil industry in Malaysia can be summarized as:
- 1870s. The oil palm was introduced to Peninsular Malaysia, then Malaya, as an ornamental plant.
- 1917. The first commercial planting of the oil palm took place. Henri Fauconnier planted this crop at his Tennamaram Estate in Batang Berjuntai, Selangor.
- 1960s. Cultivation accelerated due to the government’s agricultural diversification program. This was to ease the dependence on rubber and tin.
- 1989: Oil palm overtook rubber as Malaysia’s main commodity crop.
- 2020. Malaysia accounted for 25.8% and 34.3% of the world’s palm oil production and exports.
Today, palm oil is the leading commodity in the global oils and fats market. It has led over other competing vegetable oils and fats in terms of production, exports, and consumption since 2005. This is mainly due to three factors associated with palm oil, which the competing oils and fats cannot match. These are:
- Abundant and uninterrupted supply all year long.
- Versatility in food and non-food applications.
- Competitive trading prices.
Base rates
As of mid-2021, there were 43 companies under the Bursa Malaysia plantation sector. The base rates here refer to the performance of 41 of these companies from 2013 to 2022. Refer to the Methodology on the selection of the companies and period.
The profile of the 41 companies in terms of the Shareholders’ Funds and Total Assets are shown in the following 2 charts.
You can see that there has been some growth in the Shareholders’ Funds. Compared to 2013, the average Equity & MI of the sector in 2022 is about 20% larger.
 |
| Chart 7: Sector Equity & MI |
The average Total Assets in 2022 is 21 % bigger than that in 2013. This about matches the growth in Equity & MI.
 |
| Chart 8: Sector Total Assets |
Debt
Average industry debt has grown by a 1.7 % CAGR from 2013 to 2022. The major increase came around 2015. Thereafter the average debt level had been relatively “stable”.
Note that for most of the period, the first quartile Total Debt is zero. It meant that about a quarter of the companies had zero debt.
 |
| Chart 9: Sector Debt |
The positive sign is that the average Debt Equity ratio is below 1.0 during the period. For more part of the period, the average Debt Equity ratio is hovering around the 0.5 level.
You can see the downtrend in the Debt Equity ratio since 2019.
 |
| Chart 10: Sector debt-equity ratio |
Revenue
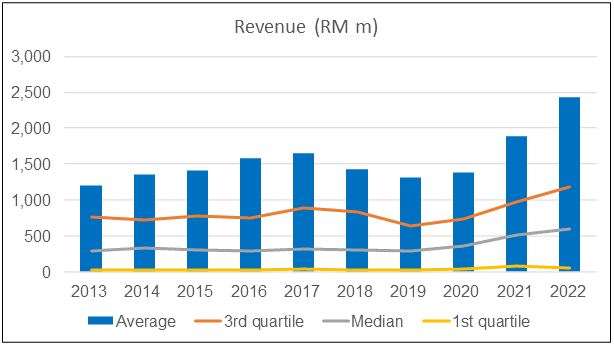
The sector revenue had been growing from 2013. While there was some decline in 2018/19, growth has since recovered. The average revenue in 2022 is 53 % larger than the average revenue in 2013.
 |
| Chart 11: Sector revenue |
To understand the picture better, I have plotted the revenue, average palm oil price, and CPO production from 2010 to 2020 relative to their respective 2013 values.
As can be seen from the chart below, you can see some relationship between the revenue and the palm oil price. There was a 0.92 correlation. You should not be surprised by this given the cyclical nature of the industry.
What is surprising is that while the revenue had grown from 2013 to 2022 there was no corresponding growth in the CPO production. Most the revenue growth was due to price growth.
 |
| Chart 12: Sector revenue, CPO production, and palm oil price index |
Profits
Not surprisingly, profits followed the revenue trend. You can see that PAT had grown since the trough in 2019.
But when you look at the lower quartile performance, you can see that there are many companies that incurred losses over the past few years. In 2022, 10 of the panel companies suffered losses.
 |
| Chart 13: Sector PAT |
Returns
The profits pattern coupled with the increasing Shareholders Funds and Total Assets meant that the returns over the past 10 years showed some volatility.
The following two charts illustrate this. For both the ROE and ROA,
Gross profitability
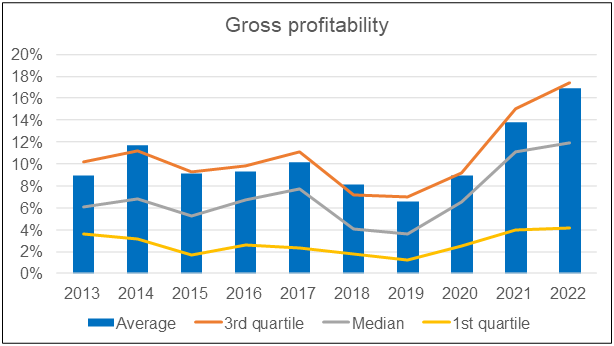
This is a profitability indicator introduced by Professor Robert Novy-Marx, University of Rochester. It is computed by dividing sales minus the cost of goods sold by total assets.
According to him, gross profitability has roughly the same power as book-to-market in predicting the cross-section of average returns.
Controlling for profitability also dramatically increases the performance of value strategies, especially among the largest, most liquid stocks. It also explains most earnings-related anomalies and a wide range of seemingly unrelated profitable trading strategies.
 |
| Chart 16: Sector gross profitability |
The average gross profitability in 2022 is about 89% higher than that in 2013. In fact, there is only one year (2017) that the sector average had gone below the 2013 level. It does suggest a resilient industry notwithstanding the declining revenue and volatile earnings.
Part of the reason for this is the relatively stable gross margins and Total Assets.
 |
| Chart 17: Sector gross profit margins |
Productivity and efficiency
The sector asset turnover every year from 2014 to 2022 was better than that of 2013. Despite the declining average revenue, the sector appeared to be able to maintain the productive use of its assets.
 |
| Chart 18: Sector asset turnover |
However, in terms of average net margin, there appears to be a general decline from 2013 with the bottom in 2019. But even the 2022 net margin was lower than that in 2021.
 |
| Chart 19: Sector net profit margin |
Cash from Operations
Throughout the period, the sector had managed to generate positive Cash flow from Operations. The average Cash flow from Operations in 2022 is about 76 % higher that that for 2013.
The only bad performance was in 2015 when the profit was low.
 | |
|
How to use the base rates
Daniel Kahneman’s inside and outside view, from Thinking Fast and Slow is a useful model when thinking about analysis and projections.
The inside view generally refers to a conclusion reached using an individual own experience and reasoning. It is the perspective of someone looking at the problem from “the inside”. The focus is on the specific situation rather than looking at a broader class of similar situations.
In contrast, the outside view refers to the perspective of someone looking at the problem "from the outside". It is the view taking into consideration the actual experience of other people.
When you analyze a company, the inside view may lead to unrealistic expectations. To counter this, you need an outside view.
This is where base rates come in. The performance of the industry would give you a basis to check on your analysis and projections.
All valuations are based on assumptions and the base rates will help to ensure that the assumptions are realistic.
Base rates are part of the data that you should use when undertaking a fundamental analysis. I hoped you can assess the performance of a particular company with the average and interquartile ranges. Furthermore, if a company is undergoing a turnaround, the base rates would also indicate what is likely.
As you can see, fundamental analysis is more than just using some formula. There are choices to be made in terms of which approach to use and what to assume.
So, if you are just starting out to analyze and value companies, it may be helpful to supplement it with third-party analyses and valuation.
There are several financial advisers who provide such analyses.
Those who do this well include people like Seeking Alpha.* Click the link for some free stock advice. If you subscribe to their services, you can tap into their business analysis and valuation.
Methodology
There are 43 companies under the Plantation sector in Bursa Malaysia in 2021. However, the data from 2010 to 2020 were not available for all.
- Boustead and Matang were listed in 2013 while Sime Darby was listed in 2015.
- Batu Kawan started to consolidate the results of KLK from 2014. The financials before this did not match that post-consolidation.
Because of these reasons, the base rates were from 2013 to 2022. This meant leaving out Sime Darby. At the same time, I excluded KLK because its results were accounted for under Batu Kawan.
The final sample thus comprised 41 companies.
Note that of these 41 companies, 9 had property development as another significant business segment.
Data analysis
The data for the base rates were extracted from the Financial Statements for each company for the period 2013 to 2022. Note that it is comprised of companies with different financial year ends.
The Financial Statements was taken from a platform/app called TIKR.com. It has been described as “The 1 Stop Platform To Do All Your Stock Market Research On”.
I have 2 types of analyses:
- The average of the group or sector.
- The distribution of individual companies within the group. For these, the quartiles and median were based on the respective metric ranking for each year.
I have the following example to illustrate the difference between these 2 types of analysis.
Suppose that there are 9 companies in the panel with the revenue, PAT, and profit margin (PAT/Revenue) as shown in the table below.
 |
| Table 1: Panel data |
To get the distribution of the profit margin, the companies are ranked (from largest to smallest) based on profit margin with the results below.
This is then used to determine the quartile and median values.
The average profit margin for the group is derived by dividing the total PAT for the group by the total revenue for the group
Group average profit margin = 121 / 865
= 14.0 %
You can also get the average profit margin by adding up individual company profit margin (132.3) and dividing by 9 = 14.7 as shown in the table.
There are then 2 average profit margins for the panel.
- The 14.0 % is looking at the performance of the sector as a whole.
- The 14.7 % is looking at the distribution of individual profit margins.
The values are different because we are looking from different viewpoints. In my analysis, the average value refers to the former computation.
Presentation of results
To capture both views, I have presented my results in the following manner using the sample tables above.
 |
| Table 3: Panel results |
I would not be providing the details for each of all metrics in this post. Instead, I will only provide the charts for all the metrics. If you require specific information, contact me at i4valueasia@gmail.com.
Limitations
The analysis covered 41 out of the 43 companies under the Bursa Malaysia plantation sector. It excluded the data from KLK and Sime Darby which together accounted for about 1/3 of the sector revenue in 2022.
I would argue that since the result of KLK is consolidated into that of Batu Kawan, the only exception is then Sime Darby. By itself, Sime Darby accounted for 14 % of the sector revenue in 2022.
Sime Darby results were available from 2015 to 2022. The table below gives you an indication of the impact of Sime Darby and KLK.
 |
| Table 4: Impact of Sime Darby and KLK |
This means that in terms of revenue and PAT, including Sime Darby and KLK data would have made some to the sector trend.
When it comes to plantation statistics eg FFB yield I would rely on the Malaysia Palm Oil Council and the Department of Statistics. This is because there are companies with plantation activities that are not under the Bursa Malaysia plantation sector.
Even so, I believe that the analyses do provide a picture of the financial performance of the plantation sector.
END
- - - - - - - - - - - - - - - - - - - - - - - - - - - - - - - - - -
How to be an Authoritative Source, Share This Post
|
Disclaimer & Disclosure
I am not an investment adviser, security analyst, or stockbroker. The contents are meant for educational purposes and should not be taken as any recommendation to purchase or dispose of shares in the featured companies. Investments or strategies mentioned on this website may not be suitable for you and you should have your own independent decision regarding them.
The opinions expressed here are based on information I consider reliable but I do not warrant its completeness or accuracy and should not be relied on as such.
I may have equity interests in some of the companies featured.
This blog is reader-supported. When you buy through links in the post, the blog will earn a small commission. The payment comes from the retailer and not from you.


Comments
Post a Comment