Is there an “Evergrande” among Bursa property stocks? (Part 1 of 2)
Case Notes 15-1. Seven red flags were identified based on Evergrande's performance. These were then used to screen for potential Evergrande among Bursa Malaysia property companies. There were none that matched all the 7 criteria.
Evergrande is one of China's largest real estate developers. It has gained infamy for becoming China's most indebted developer, with more than USD 300 billion worth of liabilities. Evergrande is now expected to be one of the largest-ever restructurings in China.
There are currently many analyses on why Evergrande is failing. If you are a retail investor, you would be better served if the red flags were raised a few years ago.
Are there red flags from Evergrande financials that could be used when looking at Malaysian property developers? Even if you are not a stock investor but a house buyer, these red flags should be part of your house-buying due diligence.
Generally, red flags are found by digging through Annual Reports. Most retail investors do not have the accounting background or time for such a detailed analysis. Many rely on financial information collated by financial platforms when assessing companies.
I wanted to see whether there were ratios and trends from financial platforms covering Evergrande that could be used as red flags. I thus analyzed Evergrande's performance from 2010 to 2020 based on such ratios and trends.
I also compared Evergrande's performance with companies under the Bursa Malaysia property sector. There were 85 companies and I grouped them into 3 - Large, Medium, and Small based on their 2020 equity.
This is a 2-part series.
- Part 1 presented here focuses on identifying red flags based on an analysis of Evergrande's performance. I identified 7 red flags and used them to identify potential “Evergrande” among the Bursa property companies. The good news is that there was no Bursa Malaysia property company that met all the 7 red flags criteria.
- But there were 3 Malaysian property companies that met 5 or 6 of the 7 red flags. Part 2 that will be published next week will dig deeper into these 3 potential “Malaysian Evergrande”.
Contents
- Summary
- Background of Evergrande’s problems
- Benchmarking against Evergrande
- Red flags
- Conclusion
- Methodology
- Appendix
This blog is reader-supported. When you buy through links in the post, the blog will earn a small commission. The payment comes from the retailer and not from you. Learn more. |
Summary
Analysts attributed Evergrande’s problems to its huge debt, high inventory, spiking payables, and poor cash generation. The charts and table below show Evergrande's deteriorating position for these metrics.
- Its Debt Equity ratio was already at 1.46 in 2010 and it increased to 2.24 by 2020.
- Evergrande only generated positive cash flow from operations for 2 out of the past 11 years. On a cumulative basis, the cash flow from operations was negative from 2010 to 2020.
- Evergrande inventory in 2020 was 3 ½ years of revenue. It had grown at 7% annually.
- In 2020, Evergrande payables were 1 ¼ year of revenue. It had grown at 13 % annually.
 |
| Table 1: Performance summary |
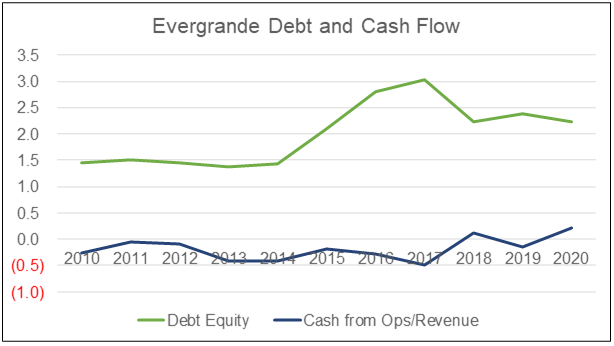 |
| Chart 1: Debt and Cash flow from Ops |
 |
| Chart 2: Inventory and Payables |
There are 7 metrics that can serve as red flags. The table below summarizes the benchmark values/criteria for them.
 |
| Table 2: Red Flags Criteria |
To be an Evergrande, a Malaysian property developer must meet all these 7 benchmark values. None of the 85 Bursa Malaysia property companies met all the 7 criteria. In other words, there are no Evergrande among them.
Despite the soft property market over the past few years as well as the MCO of 2020, I would conclude that the Malaysian property sector is resilient.
Background of Evergrande’s problems
Evergrande is part of the Global 500 - meaning that it is also one of the world's biggest businesses by revenue. It has been in the news recently because of the ballooning debts it borrowed to finance its various pursuits.
As a retail investor, you would be wondering whether there were early warning signals about Evergrande's problems.
In fact, there was an analysis by Citron Research as far back as 2012 alleging that Evergrande used dubious accounting practices.
More recently the Washington Post, reported that Evergrande had a liquidity scare in 2020. Evergrande had sent a letter in Aug 2020 to the Guangdong provincial government warning of a liquidity crisis. This was in relation to payments due in January 2021.
The letter was verified by Bloomberg at that time by people familiar with it, but Evergrande later disputed its authenticity. The crisis was averted when a group of investors waived their right to force a $13 billion repayment.
Most analysts attributed Evergrande’s problems to:
- Hugh debt load with 40 % to 50 % due within the current year.
- Spiking receivables and payables.
- High inventory mostly of undeveloped land and unsold properties.
- Off-balance sheet liabilities made to retail trusts that were reported to be a trillion yuan.
- Consistent cash burn.
- High selling, general, and admin expenses to sales ratio.
Refer to the following:
|
Many believed that Evergrande's problems were due to China’s property bubble and the government's efforts to control it. But this property bubble is not something that could be analyzed by comparing financial statements so I will not touch on this.
Benchmarking against Evergrande
Malaysian property companies do not have the same size of revenue or profits as Evergrande. We have to scale the performance so that size does not matter. This was achieved by looking at ratios and indices.
I grouped the Bursa Malaysia companies into 3 based on their total shareholders' funds (SHF):
- Large - SHF greater than RM 1 billion.
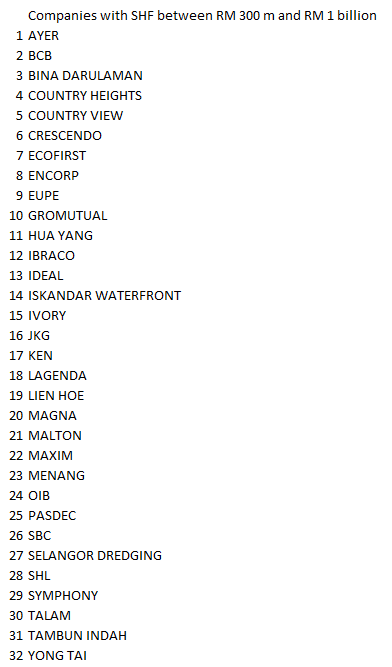
- Medium - SHF between RM 300 million and under RM 1 billion.
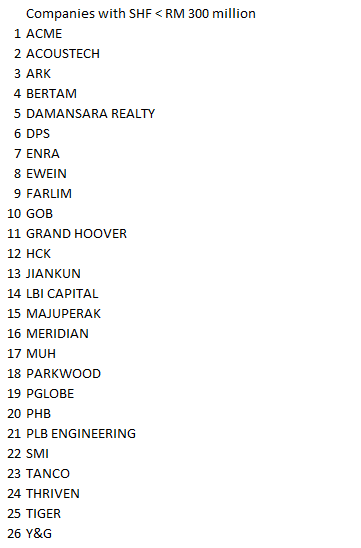
- Small - SHF less than RM 300 million.
Refer to the Methodology. In my analysis,
- I compared Evergrande's performance against those of the 3 Malaysian groups. The performance for these 3 Malaysian groups was based on their respective averages.
- I picked out the individual Malaysian companies with performances that were worst than those of Evergrande.
- Sometimes I identified individual Malaysian companies whose performance was opposite those of Evergrande. This was to emphasize the negative position of Evergrande. For example, if Evergrande had a compounded annual decline for a metric, I identified Malaysian companies with CAGR.
There were 2 categories of analyses carried out:
- Looking at the average and absolute values at a certain point in time.
- Looking at trends. This looked at how the values changed from 2010 to 2020.
Size profile
Evergrande far outstripped any Malaysian property developer on Total Equity or Total Assets as can be seen from the table below.
 |
| Table 3: Size profile |
But size alone did not account for Evergrande’s current predicament. It is about how it grew to where it is today that mattered.
To illustrate these growth rates, I plotted the Total Equity and Total Assets indices for both. The index was constructed by comparing the value of each year by the respective value in 2010.
For example, the Total Equity of Evergrande was RMB 21.37 billion in 2010 while it was RMB 350.43 in 2020.
- The index for 2010 was 21.37 / 21.37 = 1.0.
- The index for 2020 was 350.43 /21.37 = 16.4
 |
| Chart 3: Equity Index |
 |
| Chart 4: Total Assets Index |
You can see from Charts 3 and 4 the phenomenal growth of Evergrande compared to the Malaysian counterparts.
- From 2010 to 2020, Evergrande's Total Equity and Total Assets grew at 22 % and 24 % annually.
- The growth rates for the Total Equity and Total Assets for the 3 groups of Malaysian property companies did not come close.
But if you looked at individual Malaysian companies, there were about a dozen who exceeded Evergrande growth rates. Refer to Table 5.
 |
| Table 5: Equity and Total Asset Growths - individual company comparisons Note: In this context, I considered a worse performance as a growth rate that was lower than that achieved by Evergrande |
Red flags
In this section, I tracked the performance based on the metrics that exemplified the negative traits of Evergrande. I defined the negative traits as high Debt, high Inventory, high Receivables, high Payables, and negative Cash flow.
Debt
Evergrande had high Debt. At the same time, it also had a high Debt growth rate as shown in the Debt Index chart.
 |
| Chart 5: Debt Index |
On a Debt Equity basis, Evergrande had an average ratio of 2.0 for the period 2010 to 2020. There was one Malaysia company - Encorp - that had an average Debt Equity ratio greater than 2.0 for the same period.
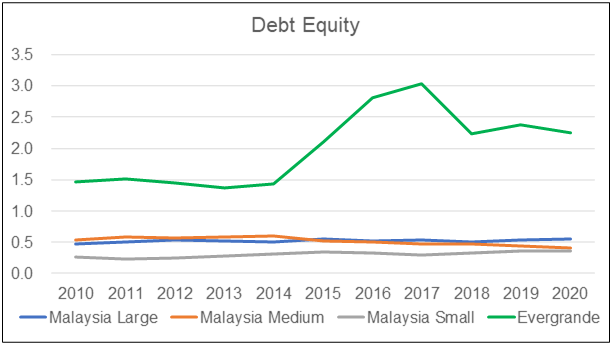 |
| Chart 6: Debt Equity |
You can see from Table 7 that the Debt-Equity ratio for Evergrande had grown at 7 % annually from 2010 to 2020.
A 7 % annual growth was not exceptional as there were 25 Malaysian companies that had exceeded this growth rate. The main difference was that none of the Malaysian companies had a Debt Equity ratio of more than 1.00 in 2020.
 |
| Table 7 Debt Equity parameters |
Inventory
Several analysts had pointed out that one of Evergrande’s problems was the increasing level of unsold properties.
To get an estimate of this, I plotted Evergrande Inventory Days. This represented the level of inventory relative to the revenue for the respective year.
 |
| Chart 7: Inventory Days |
As can be seen from Chart 7, Evergrande had about 3 1/2 years of inventory for the past few years. This far exceeded the average for the 3 Malaysian groups
You would think that Evergrande's performance was bad.
Receivables
When you looked at Receivable Days, Evergrande's average performance from 2010 to 2020 was much lower than those of the 3 Malaysian groups. Refer to Chart 8. I put this to the different marketing conditions between China and Malaysia.
However, when it came to changes in the Receivable Days, Evergrande's growth was very much higher than those of the Malaysian groups. Refer to Table 9. But there were 9 Malaysian companies whose growth in Receivable Days exceeded that of Evergrande.
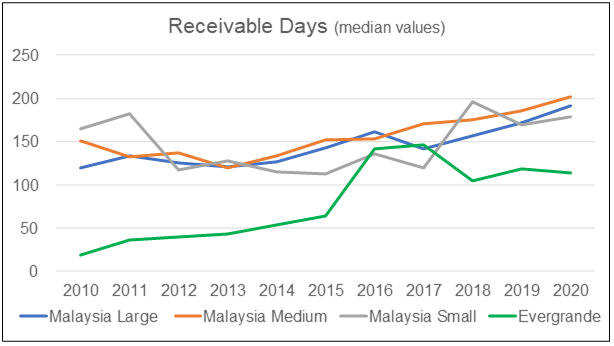 |
| Chart 8: Receivable Days |
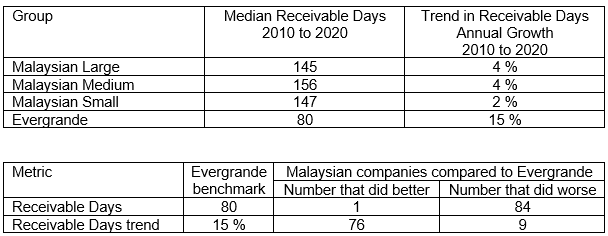 |
| Table 9: Receivable Days Parameters |
Payables
Evergrande Payable Days have also increased dramatically over the past few years. This is probably an indication that it is facing cash problems. Refer to Chart 9.
Despite this, there was a significant number of Malaysian companies that had higher Payables Days. Some had a higher growth rate in the Payable Days as shown in Table 10.
 |
| Chart 9: Payable Days |
 |
| Table 10: Payable Days Parameters |
Cash from Ops
Evergrande had a poor track record of generating Cash flow from Operations. Over the period from 2010 to 2020, the cumulative Cash flow from Operations was negative. In fact, Evergrande only had 2 positive Cash flows from Ops years during the period from 2010 to 2020.
 |
| Chart 10: Cash Flow From Ops |
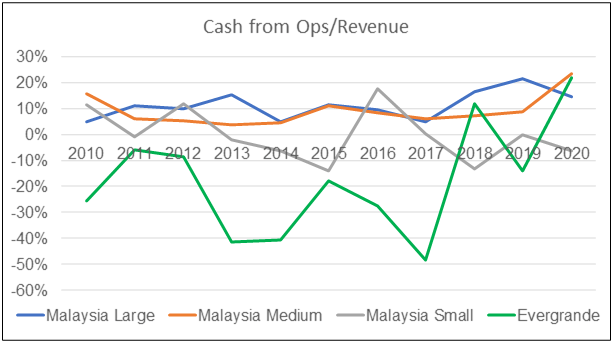
You should not be surprised to see that Evergrande cash flow from Ops as a % of Revenue were - 18 %. Contrast this with the 3 Malaysian groups which had positive average Cash flow from Ops to Revenue ratio. Refer to Table 11.
On an individual company basis, there were 15 Malaysian companies whose Cash flow from Ops to Revenue ratio was less than - 18 %. In other words, they were worse than Evegrande.
 |
| Chart 11: Cash Flow From Ops/Revenue |
 |
| Table 11: Average Cash From Ops/Revenue |
Conclusion
We are looking for Malaysian property developers that had similar or worse performance than Evergrande. I based it on the following metrics and criteria.
These benchmark numbers were derived based on Evergrande’s financial statements. According to several analysts, Evergrande's actual position is much worst. This is because it had off-balance sheet liabilities. Furthermore, there are some who questioned Evergrande’s accounting treatment.
The analyses showed that for each of the metrics there are more than a dozen Malaysian property companies who did worse than Evergrande.
But to be a potential Evergrande, a company's performance must exceed those of Evergrande in all. In this context, there was no Malaysian property company that met all the criteria.
None of the Malaysian property developers have an Evergrande-type of debt problem. This is despite the soft property market and the pandemic measures. If nothing else, it indicated that the industry is resilient.
However, there were 3 companies that came close:
- There was one Malaysian company that met 6 out of the 7 criteria.
- There were another 2 that met 5 out of the 7 criteria.
Join me in Part 2 as I dug deeper into these 3 companies.
Methodology
There are 99 companies under the Property sector in Bursa Malaysia in 2021. These have shareholder funds (SHF) ranging from RM 15 million to RM 19 billion. I have categorized them into 3 groups based on the shareholders’ funds.
- Large - SHF greater than RM 1 billion. There are 31 companies here.
- Medium - SHF between RM 300 million and under RM 1 billion. There are 37 companies in this group.
- Small - SHF less than RM 300 million. The balance 31 companies are in this group.
My focus was to track the performance of these companies from 2010 to 2020. As such I had to leave out the following:
- Those that did not have 11 years of listing history. There were 9 companies left out because of this.
- 3 companies were left out because they did not provide gross profit figures in their Financial Statements. Although they had other information, to ensure consistency in my comparisons, I left them out.
- 1 was left out because of a change in the financial year and hence there was one year where no data was available. I did not want to extrapolate the date for the missing year and hence left it out.
- One had negligible gross profits but higher PAT for certain years. I left this out so as not to skew the profitability analysis.
The final sample thus comprised the following profile. Refer to Appendix 1 for the list of the companies.
- 27 Large companies.
- 32 Medium ones.
- 26 Small companies.
Data analysis
The data for the analysis were extracted from the Financial Statements for each company for the period 2010 to 2020. Note that it is comprised of companies with different financial year ends.
The Financial Statements was taken from a platform/app called TIKR.com It has been described as “The 1 Stop Platform To Do All Your Stock Market Research On”.
To be transparent, TIKR reached out to me some time back to test the app and provide feedback. TIKR has been in its building stages for almost 2 years now and has finally decided to soft launch their site in beta.
Because of the different sample sizes in each group, I have used the average value when comparing the metrics for the various groups. This will ensure an apple-to-apple comparison.
- For most of the analysis, I used the mean to represent the average.
- However, for Inventory, Receivables, and Payable, I used the median to represent the average. This was because there were extreme values for these two metrics and the mean would skew the average.
- The average was based on the values for each year from 2010 to 2020.
For those analyses that involved ratios, the average values were derived based on the group total. For example, the PAT/Revenue ratio was derived by dividing the group PAT by the group Revenue. It was not the average of the PAT/Revenue of each of the companies in the group.
The example below illustrated my point. Suppose that there are 9 companies in the group with the revenue, PAT, and profit margin (PAT/Revenue) as shown in the table below.
 |
| Table 12: Sample data |
There are 2 ways to get the average profit margin.
- The first is to take the average profit margin for each of the 9 companies. In the example, the average would be 14.7 %.
- The other way is to divide the total PAT for 9 companies by the total revenue for the 9 companies. In this case the average = 121 / 865 = 14.0 %.
There are then 2 average profit margins for the group:
- The 14.0 % is looking at the performance of the group as a whole.
- The 14.7 % is looking at the distribution of individual profit margins.
The values are different because we are looking from different viewpoints. I focussed on the performance of the group as a whole.
Determining the growth rates
There are situations with negative values or missing values. To cater for such situations the growth rates were taken as the gradient of the best fit line for the values.
The gradient was determined using the SLOPE function in Excel. The best fit line was based on the least square method.
The SLOPE function would provide the amount of change per year in the units for the metrics. To convert the amount of change into % change, I then divided the amount by the absolute of the average values. I have termed this % change as the annual growth rate.
In many cases, the difference between this growth rate and the CAGR was close. However, this % annual growth rate would be distorted if the average values from 2010 to 2020 were small. For such cases, I did not report the value. Rather I merely stated whether it was very positive or very negative.
Conversion to USD
Evergrande is a much bigger company compared to the Malaysian property companies. To enable an apple-to-apple comparison, I used ratios and indices.
Indices are used to show the trend. They are derived by dividing the value for a particular year by the respective 2010 value.
For those cases where I needed to compare absolute values, I converted them to USD based on the following exchange rates. These were the rates used by TIKR.com for their 2020 conversion.
USD 1 = RM 4.3
USD 1 = RMB 6.5
Presentation of information
Apart from presenting the metrics in the form of a chart, I also summarized some of the analysis in a 2-tables format.
The chart would show the metric for each year from 2010 to 2020 for Evergrande and the 3 Malaysia groups as shown below.
For the 2-tables format, the upper table as shown below compared the performance of the 3 Malaysian groups with Evergrande.
- Middle column. The statistics for the Malaysian groups are either the average or median of the metric for each year from 2010 to 2020. In the case of Evergrande, it was the actual metric from 2010 to 2020.
- Rightmost column. For the Malaysian statistics, it was the annual growth rate from 2010 to 2020. If the middle column showed the medians, then the growth rate was for the medians for each of the Malaysian groups. In the case of Evergrande, it was the change in the metric from 2010 to 2020.
In the 2-tables format, the lower table summarized the number of individual Malaysian companies that did better/worse than Evergrande. In the example of Table 10
- The second column from the left. This represents the benchmark for comparing the performance of Malaysian companies.
- Third column from the left. This is the number of Malaysian companies that did better than Evergrande based on the benchmark.
- Last column from the left. This is the number of Malaysian companies that did worse than Evergrande.
- Note that the number of companies that did better and worse will add up to the panel number of 85.
The definition of better or worse would depend on the metric. For example,
- For Payable Days, worse performance meant having longer Payable Days compared to the benchmark.
- But if it was for ROE, worse performance meant having lower ROE compared to the benchmark.
Appendix
End of Part 1 of 2
Part 2 of 2 will be published on 24 Oct 2021
- - - - - - - - - - - - - - - - - - - - - - - - - - - - - - - - -
How to be an Authoritative Source, Share This Post
|
Disclaimer & Disclosure
I am not an investment adviser, security analyst, or stockbroker. The contents are meant for educational purposes and should not be taken as any recommendation to purchase or dispose of shares in the featured companies. Investments or strategies mentioned on this website may not be suitable for you and you should have your own independent decision regarding them.
The opinions expressed here are based on information I consider reliable but I do not warrant its completeness or accuracy and should not be relied on as such.
I may have equity interests in some of the companies featured.
This blog is reader-supported. When you buy through links in the post, the blog will earn a small commission. The payment comes from the retailer and not from you.




Comments
Post a Comment