Is LEESK one of the better Bursa furniture stocks to invest in?
Value Investing Case Study 24-1. A fundamental analysis of one of Bursa Malaysia furniture companies. This company was screened based on my earlier post on the Malaysian furniture sector.
In my post of 5 Dec 2021 “Which are the better stocks in Bursa Malaysia furniture sector?” I had identified 3 furniture companies for further analysis. The screening process was based on a number of metrics that focused on the business fundamentals.
One of them was Lee Swee Kiat Group Bhd (LEESK or the Group). As of 13 Jan 2022, LEESK was trading at RM 0.83 per share compared to its Book Value of RM 0.37 per share.
Does this meant that we have missed the buying opportunity? We should not jump to such a conclusion without digging deeper into the company.
That was what I did and while fundamentally sound, I am not sure about the margin of safety at the current price.
As such it is not one of the better Bursa furniture stocks to go in at this juncture. How far should the price drop before it becomes a value investing opportunity?
Join me as I lay out the investment thesis and suggest an entry price. Should you challenge my analysis and still buy? Well, read my Disclaimer.
Contents
- Background
- Financially sound
- Strong track record
- Management performed better than average
- Shareholders’ value created
- Margin of safety only under optimistic scenario
- Conclusion
|
Background
LEESK is actually in the mattress business. The Group specializes in 100% natural latex and spring mattresses. The Group claimed that it is one of the most extensive mattress manufacturers in South East Asia. Its facilities included one stop production lines for natural latex foam and polyurethane foam.
The Group described its business model as:
“…a niche player focusing on high value added 100% natural latex & premium branded bedding. We adopt an asset-light model…focuses on building brand-equity through branding, efficiencies and sustainability initiatives via continual improvement in operations to compete on equal footing at the world market.”
In its 2020 Annual Report, LEESK said that more than 50% of its products are exported. 70% of the domestic revenue are derived from direct Business-to-Consumer (“B2C”) sales channels.
However, the Group did provide any geographical summary in its segment report. Furthermore, I could not find any report on it exports in the past Annual Reports. The only export information was some comments such as:
“…the Group achieved broad based increase in volume in both export and domestic markets” 2014 and 2018 Annual Reports.
I took the lack of geographical information to mean that the export revenue became relatively large only recently. Also, its earnings contribution is probably disproportionately smaller than the domestic earnings. Otherwise, the Group would have mentioned it.
For LEESK, the B2C sales channel consist of direct showrooms as well as direct participation in consumer fairs. The Group operates a retail chain store under International Brands Gallery – IBG. This promotes ergonomic beddings and furniture.
LEESK reported that the balance of its domestic sales was through wholesales. This meant that the Group had yet to tap into the online channel despite talking about its B2C channel. The online sale is the fastest growth channel for mattresses in the US.
Financially sound
LEESK had a Total Capital Employed (TCE) of RM 74 million as of Sep 2021. Shareholders’ funds accounted for 81 % of this with the balance from Debt & leases. 78 % of its TCE was deployed for the operations with the balance mainly in cash.
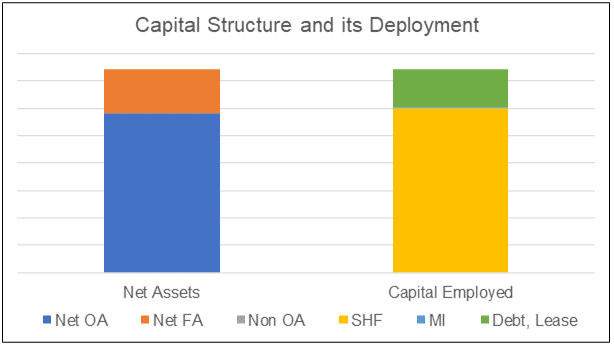 |
| Chart 1: Sources and Uses of Funds |
LEESK Debt Equity ratio was thus 0.23 compared to the furniture sector average Debt Equity of 0.17 in 2020. The Group’s Debt Equity ratio had been declining over the past decade as can be seen from the chart below.
 |
| Chart 2: Debt Equity Profile |
From 2010 to 2020, the Group was able to generate an average of RM 10.9 million per year Cash Flow from Operations. This was equivalent to about 15 % of its average annual revenue over the same period. The Malaysian furniture industry average annual Cash Flow from Operations was about 7% of the average annual revenue.
I would rate LEESK as financially sound.
Strong Track Record
For YTD Q3 2021, the Group achieved revenue of RM 72 million compared to RM 66 million for the same period last year. The YTD Q3 2021 PAT was RM 5.9 million compared to RM 5.2 million for the same period last year.
You would have thought that this was a good performance. But the Group had reported that the current YTD performance was affected by the comparative poorer Q3 2021 results. This was because of the longer Covid-19 Movement Control Order period compared to that of last year.
The current YTD performance is in line with the long-term performance as shown in the Performance Index chart.
 |
| Chart 3: Performance Index |
The Group revenue had growth 4.7 % CAGR from 2010 to 2020. There was a 17 % increase in revenue in 2017 compared to that of 2016. Management reported that this was a broad-based increase in both the domestic sales and exports.
The 33 % increase in revenue from 2017 to 2018 was attributed to 2 factors. One was a broad-based increase in revenue and the other was the acquisition of Mattress Factory Outlet. There was not sufficient information to estimate the contribution by the Mattress Factory Outlet. But note that the 2019 revenue was about the same as that for 2018.
Gross profitability has also improved from the 27 % average (2010 to 2012) to an average of 39 % for 2018 to 2020.
The outstanding performance was the PAT which had grown from RM 1.7 million in 2010 to RM 6.5 million in 2020. This has resulted in an average ROE of 15 % over the past 3 years (2018 to 2020) compared to the average of 7 % from 2010 to 2012.
A DuPont analysis of the ROE showed that margin expansion was the main reason for the improvement in the ROE. The reduction in Leverage also contributed to the better ROE. This was despite the declining Asset Turnover.
 |
| Chart 4: DuPont Analysis |
The declining Asset Turnover suggested that the growth in Total Assets was more than the growth in revenue. In other words, revenue growth was driven by a much higher growth in Total Assets.
To get a better understanding of what drove the increase in the gross profits, I looked at a number of factors affecting it.
- For the first half of the decade, the gross profit margins improved even though revenue did not increase significantly. I interpreted this as improvements in productivity and/or efficiencies. This was in line with the Group focus on the continual improvement in operations.
- The trend in the SGA margin was lower than that for gross profit margin. This meant that as the sales increased, SGA did not increase proportionately resulting in better net profit margins.
- The trend in the Depreciation and Amortization (DA margin in the chart) was lower than that for the gross profit margin. Larger sales had resulted in relatively lower proportion of Depreciation and Amortization. This is probably the results of economies of scale.
 |
| Chart 5: Operating Profile |
The focus on continual improvements in the operations had translated into a better bottom line. This should benefit the Group if they can continue to grow revenue.
Management performed better than average
LEESK Board in 2020 comprised of 3 Executive Directors and 4 Non-Executive Directors. There was also an Alternate Director to the Executive Chairman.
- The 3 Executive Directors was with the Group before its listing days. They are on average 60 years old.
- One of the Non-Executive Directors is a Non-Independent Director who was with the Group before the listing days.
- The 3 other Non-Executive Directors are Independent Directors with an average Board tenure of 7 years and an average age of 67 years.
5 senior managers were featured in the 2020 Annual Report. They are on average 49 years old and have an average of 10 years of service with the Group.
As can be seen, the Executive Directors and management team have a long history with the Group. At the same time, the Non-Independent Directors control about 53 % of the voting shares of LEESK.
With such a length of service and control, how did management perform? I assessed management based on two factors - how they performed relative to the industry and how they allocated capital.
The industry comparison is shown in the following charts and summarized in the table.
- LEESK revenue grew at a faster rate compared to the furniture industry average revenue.
- The Group ROA was about the industry average. However, over the past decade LEESK had a more uptrend profile whereas the industry had a “humped” pattern.
 |
| Table 1: Industry Comparison |
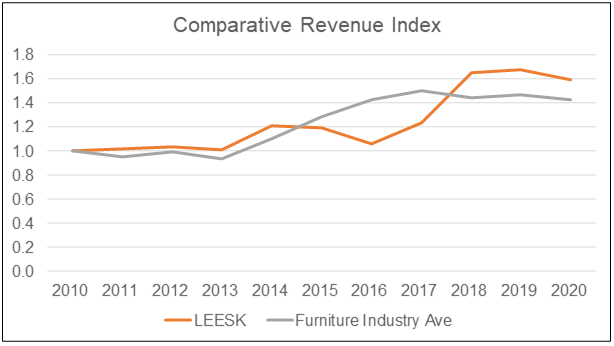 |
| Chart 6: Comparative Revenue |
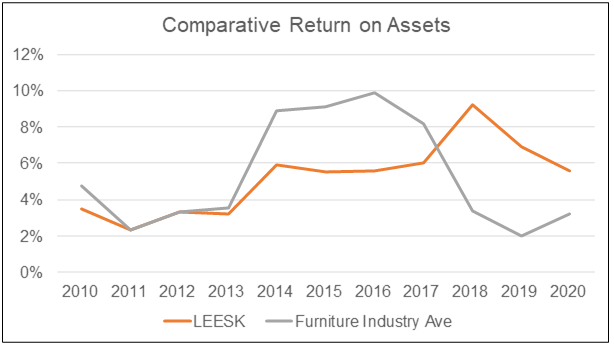 |
| Chart 7: Comparative Returns |
When it came to capital allocation, the Group generated RM 120 million Cash Flow from Operations from 2010 to 2020. These were deployed as follows:
- RM 20 million was paid out as dividends. Considering that the Group generated about RM 52 million of PAT during the same period, this is equal to a pay out ratio of 43 %.
- RM 3 million was spend on treasury shares.
- RM 41 million was spend on net CAPEX and acquisitions.
- Cash increased by RM 22 million from 2010 to 2020.
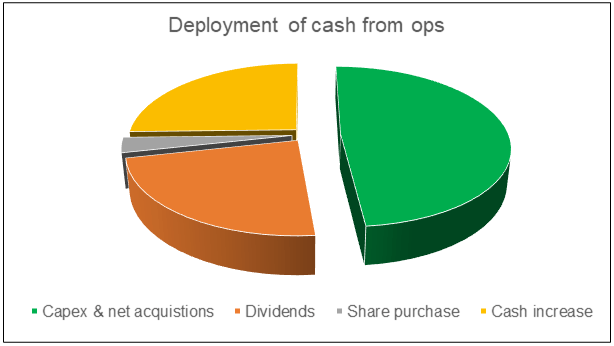 |
| Chart 8: Deployment of Cash Flow from Ops |
I would consider this a good capital allocation performance. However, there is an item of concern.
The Group entered into an asset purchase agreement on 27 Jun 2019 to acquire the business of Italhouse furniture retail group. This was through a 70:30 joint venture with the vendor, for a total purchase consideration of approximately RM4.9 million.
The Group made part payment of approximately RM3 million. However, the vendor was unable to fulfil certain conditions precedent and thus the operations was not consolidated into the Group’s account. The Group has taken an impairment charge of RM1 million in Q4 of 2020.
It does raise questions about the management ability to carry out a due diligence exercise.
Notwithstanding this blip, I would rate management performance as better than average.
Shareholders’ value created
From an overall perspective, I consider a company as fundamentally strong if it had been able to increase shareholders’ value.
I assessed this based on 3 metrics where I compared the returns with the respective cost of funds as shown below. Shareholders’ value is created when the returns are greater than the cost of funds.
 |
| Table 3: Shareholders' Gain |
LEESW strong market performance as per Table 3 was because of the Par Value reduction exercise carried out in September 2010 to eliminate prior year losses. With that exercise, LEESK restored the health of its balance sheet.
Margin of safety only under optimistic scenario
My valuation model was based on a single-stage model with the following.
EBIT = Gross Profit - SGA
Free cash flow to the firm FCFF = EBIT(1-t) X (1 - Reinvestment rate)
Value = FCFF X (1 + g) / (r - g)
Where:
r = WACC
g = growth rate
Reinvestment rate = growth rate/return
I considered two scenarios:
- A Conservative Scenario where the parameters are based on the past 4 years average. This is to take into account the first spike in revenue (in 2017) and the 2020 Covid-19 measures.
- An Optimistic Scenario where the parameters are based on the average for 2018 and 2019. This is to account for the changes due to the acquisition of Mattress Factory Outlet in 2018 and excluding the Covid-19 impact in 2020.
The assumptions under both scenarios are shown below.
 |
| Table 4: Valuation Assumptions Notes (a) The past 10 years average was 31.0 %. (b) The SGA margin had declined from 22.7 % in 2017 to 20.9 % in 2020. The Optimistic value is higher because the value in 2020 had declined. (c) TCE = Total Capital Employed = SHF + MI + Debt - Cash (d) As per the chart below. Source: Trading Economics |
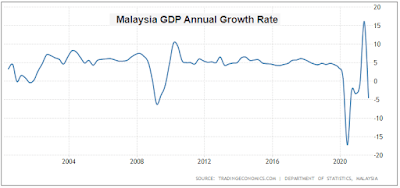 |
| Chart 9: GDP Growth Rate |
The results of the valuation are summarized in Table 5.
- Based on the above assumptions, with the market price at RM 0.83 per share (as of 13 Jan 2022), there is no margin of safety under the Conservative Scenario.
- There is only a margin of safety under the Earnings Value with 5 % growth under the Optimistic Scenario. Even then, there is only a 17 % margin of safety.
 |
| Table 5: Valuation |
 |
| Chart 10: Valuation |
I am a conservative value investor and I would have preferred a margin of safety under the Conservative Scenario. The Optimistic Scenario is riskier. This is because it assumed that LEESK would be able to maintain it operating margins as well as continue to grow at 5% CAGR.
The growth challenge is because the domestic mattress sector is a mature market. At the same time, the weak forex had provided some tailwind to the exports. As such the perpetual 5 % growth will be a risk.
Of course, one risk mitigation strategy is for the Group to diversify into other furniture products. However, there is no track record for this.
Given these, I would not rely on the Optimistic Scenario. I prefer to have the margin of safety from the Earnings with growth value under the Conservative Scenario. In other words, my target entry price would be RM 0.55 per share or lower based on 25% margin of safety.
|
Conclusion
The analysis showed that LEESK is fundamentally sound.
- The Group is financially strong with low Debt Equity ratio and a history of generating Cash Flow from Operations.
- The Group had a good track record in improving the top line and bottom line.
- Management had performed well relative to the industry. They have been able to create shareholders’ value.
But a good company as represented by its strong fundamentals does not necessary mean that it is a good investment. A good investment is one that enable you to make money. From a value investment perspective, this is buying at a price that is less than the intrinsic value. I look for at least a 25 % margin of safety.
In the context of LEESK, there is no margin of safety based on a Conservative Scenario. There is only a margin of safety if you accept the Optimistic Scenario.
I am a conservative value investor and as such I would conclude that LEESK is not one of the better Bursa Malaysia furniture companies to invest in.
End
- - - - - - - - - - - - - - - - - - - - - - - - - - - - - - - - -
How to be an Authoritative Source, Share This Post
|
Disclaimer & Disclosure
I am not an investment adviser, security analyst, or stockbroker. The contents are meant for educational purposes and should not be taken as any recommendation to purchase or dispose of shares in the featured companies. Investments or strategies mentioned on this website may not be suitable for you and you should have your own independent decision regarding them.
The opinions expressed here are based on information I consider reliable but I do not warrant its completeness or accuracy and should not be relied on as such.
I may have equity interests in some of the companies featured.
This blog is reader-supported. When you buy through links in the post, the blog will earn a small commission. The payment comes from the retailer and not from you.


Comments
Post a Comment