Hunting for Thai steel and metal companies
Case Notes 21. This post compiles the based rates for the steel and metal sector in Thailand. I have also identified some potential steel companies under SET for further investigation.
I invest in cyclical companies. As such I hunt for companies in the steel, property and even the oil & gas sectors.
Historically I have hunted for steel companies in Malaysia and the US. Given my understanding of the sector, I wanted to see whether I could apply my knowledge to the steel companies in Thailand.
Steel is both a cyclical and global sector. Steel prices in any country are affected by the global supply and demand situation as well as local factors. When analysing steel companies in a particular country, having based rates for the steel sector in that country is critical.
This article compiles the base rates for the steel companies under the Thailand stock exchange or SET. Consider them as the starting point when analysing the steel companies in Thailand.
At the same time, I have also identified 4 potential candidates under the SET steel sector for further investigation.
Should you go an invest in these companies? Well, read my Disclaimer!
Contents
- Summary
- Sector background
- Performance
- Screening for opportunities
- Methodology
- Appendix 1
|
Summary
I tracked the past 12 years' performance of 23 iron and steel companies under the Stock Exchange of Thailand (SET) to serve as base rates. The key results were:
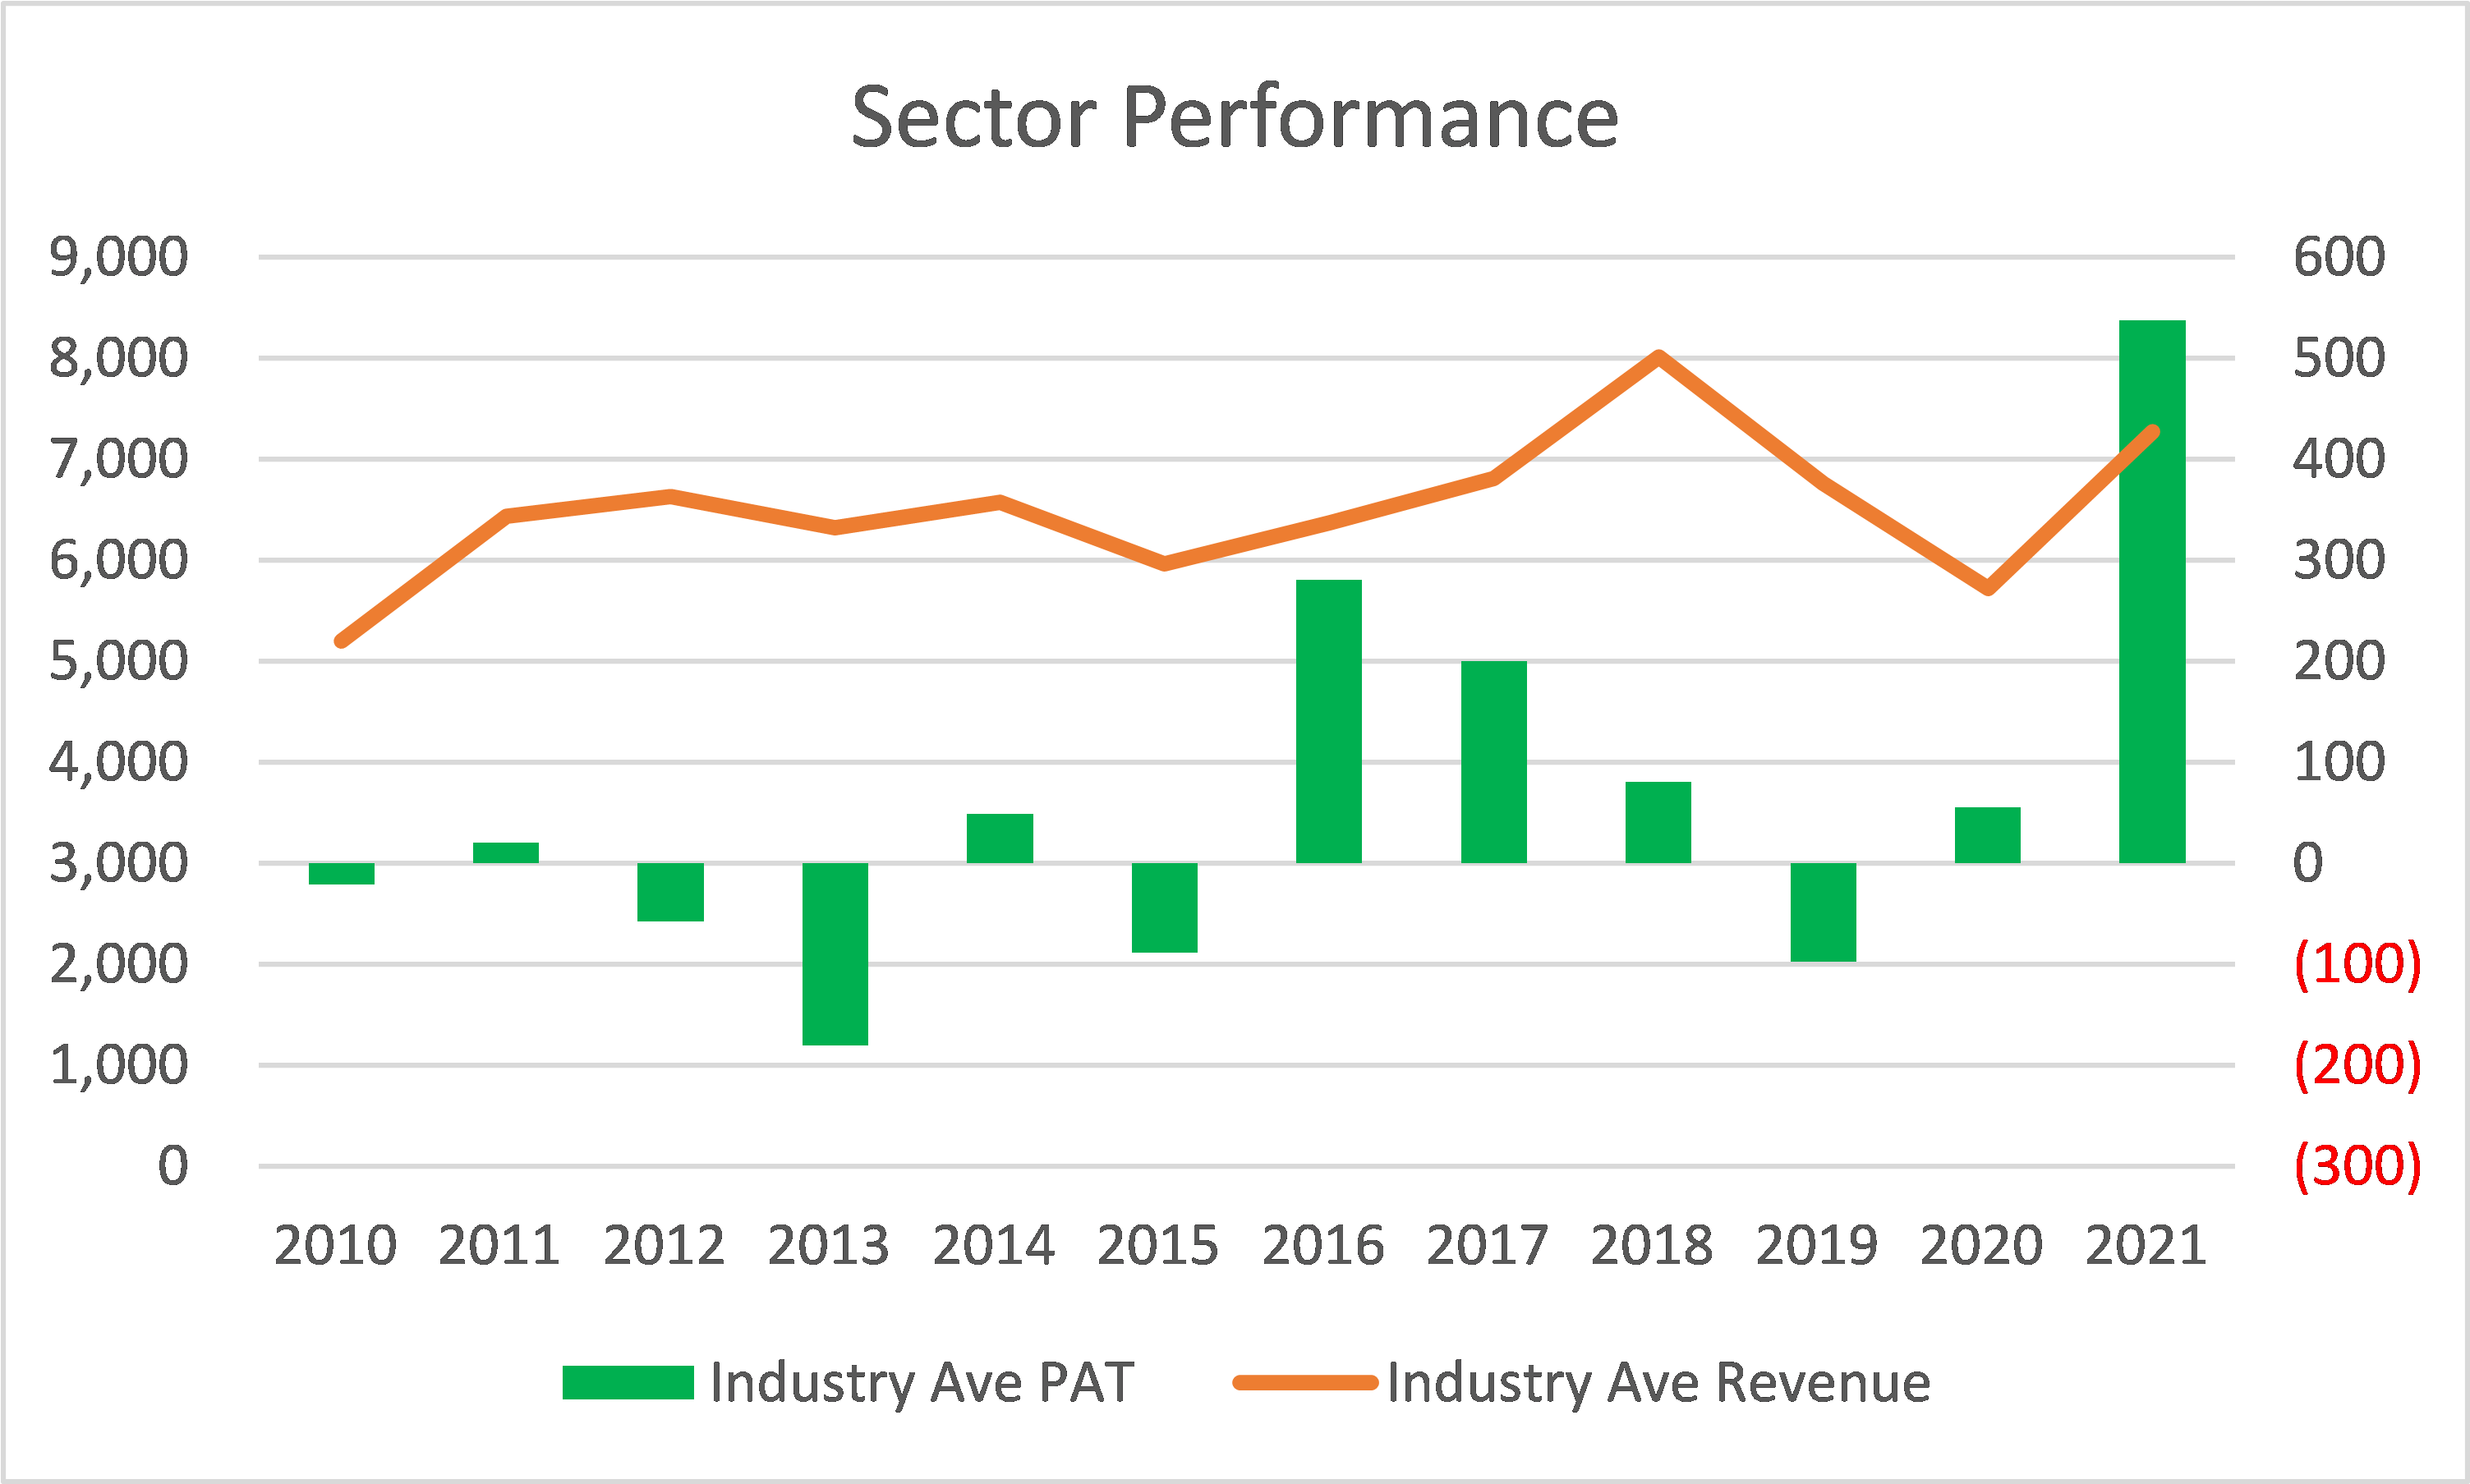
- The sector mean revenue grew at a 3.1 % CAGR from 2010 to 2021.
- Over the past 12 years, the sector was only profitable for 7 years (as represented by the sector mean PAT). 2021 was an extraordinary year.
 |
| Chart 1: Sector Performance |
- Not surprisingly, the sector ROE had been declining since 2010. It was the exceptional profits in 2021 that enabled the sector 2021 ROE to be higher than that in 2010.
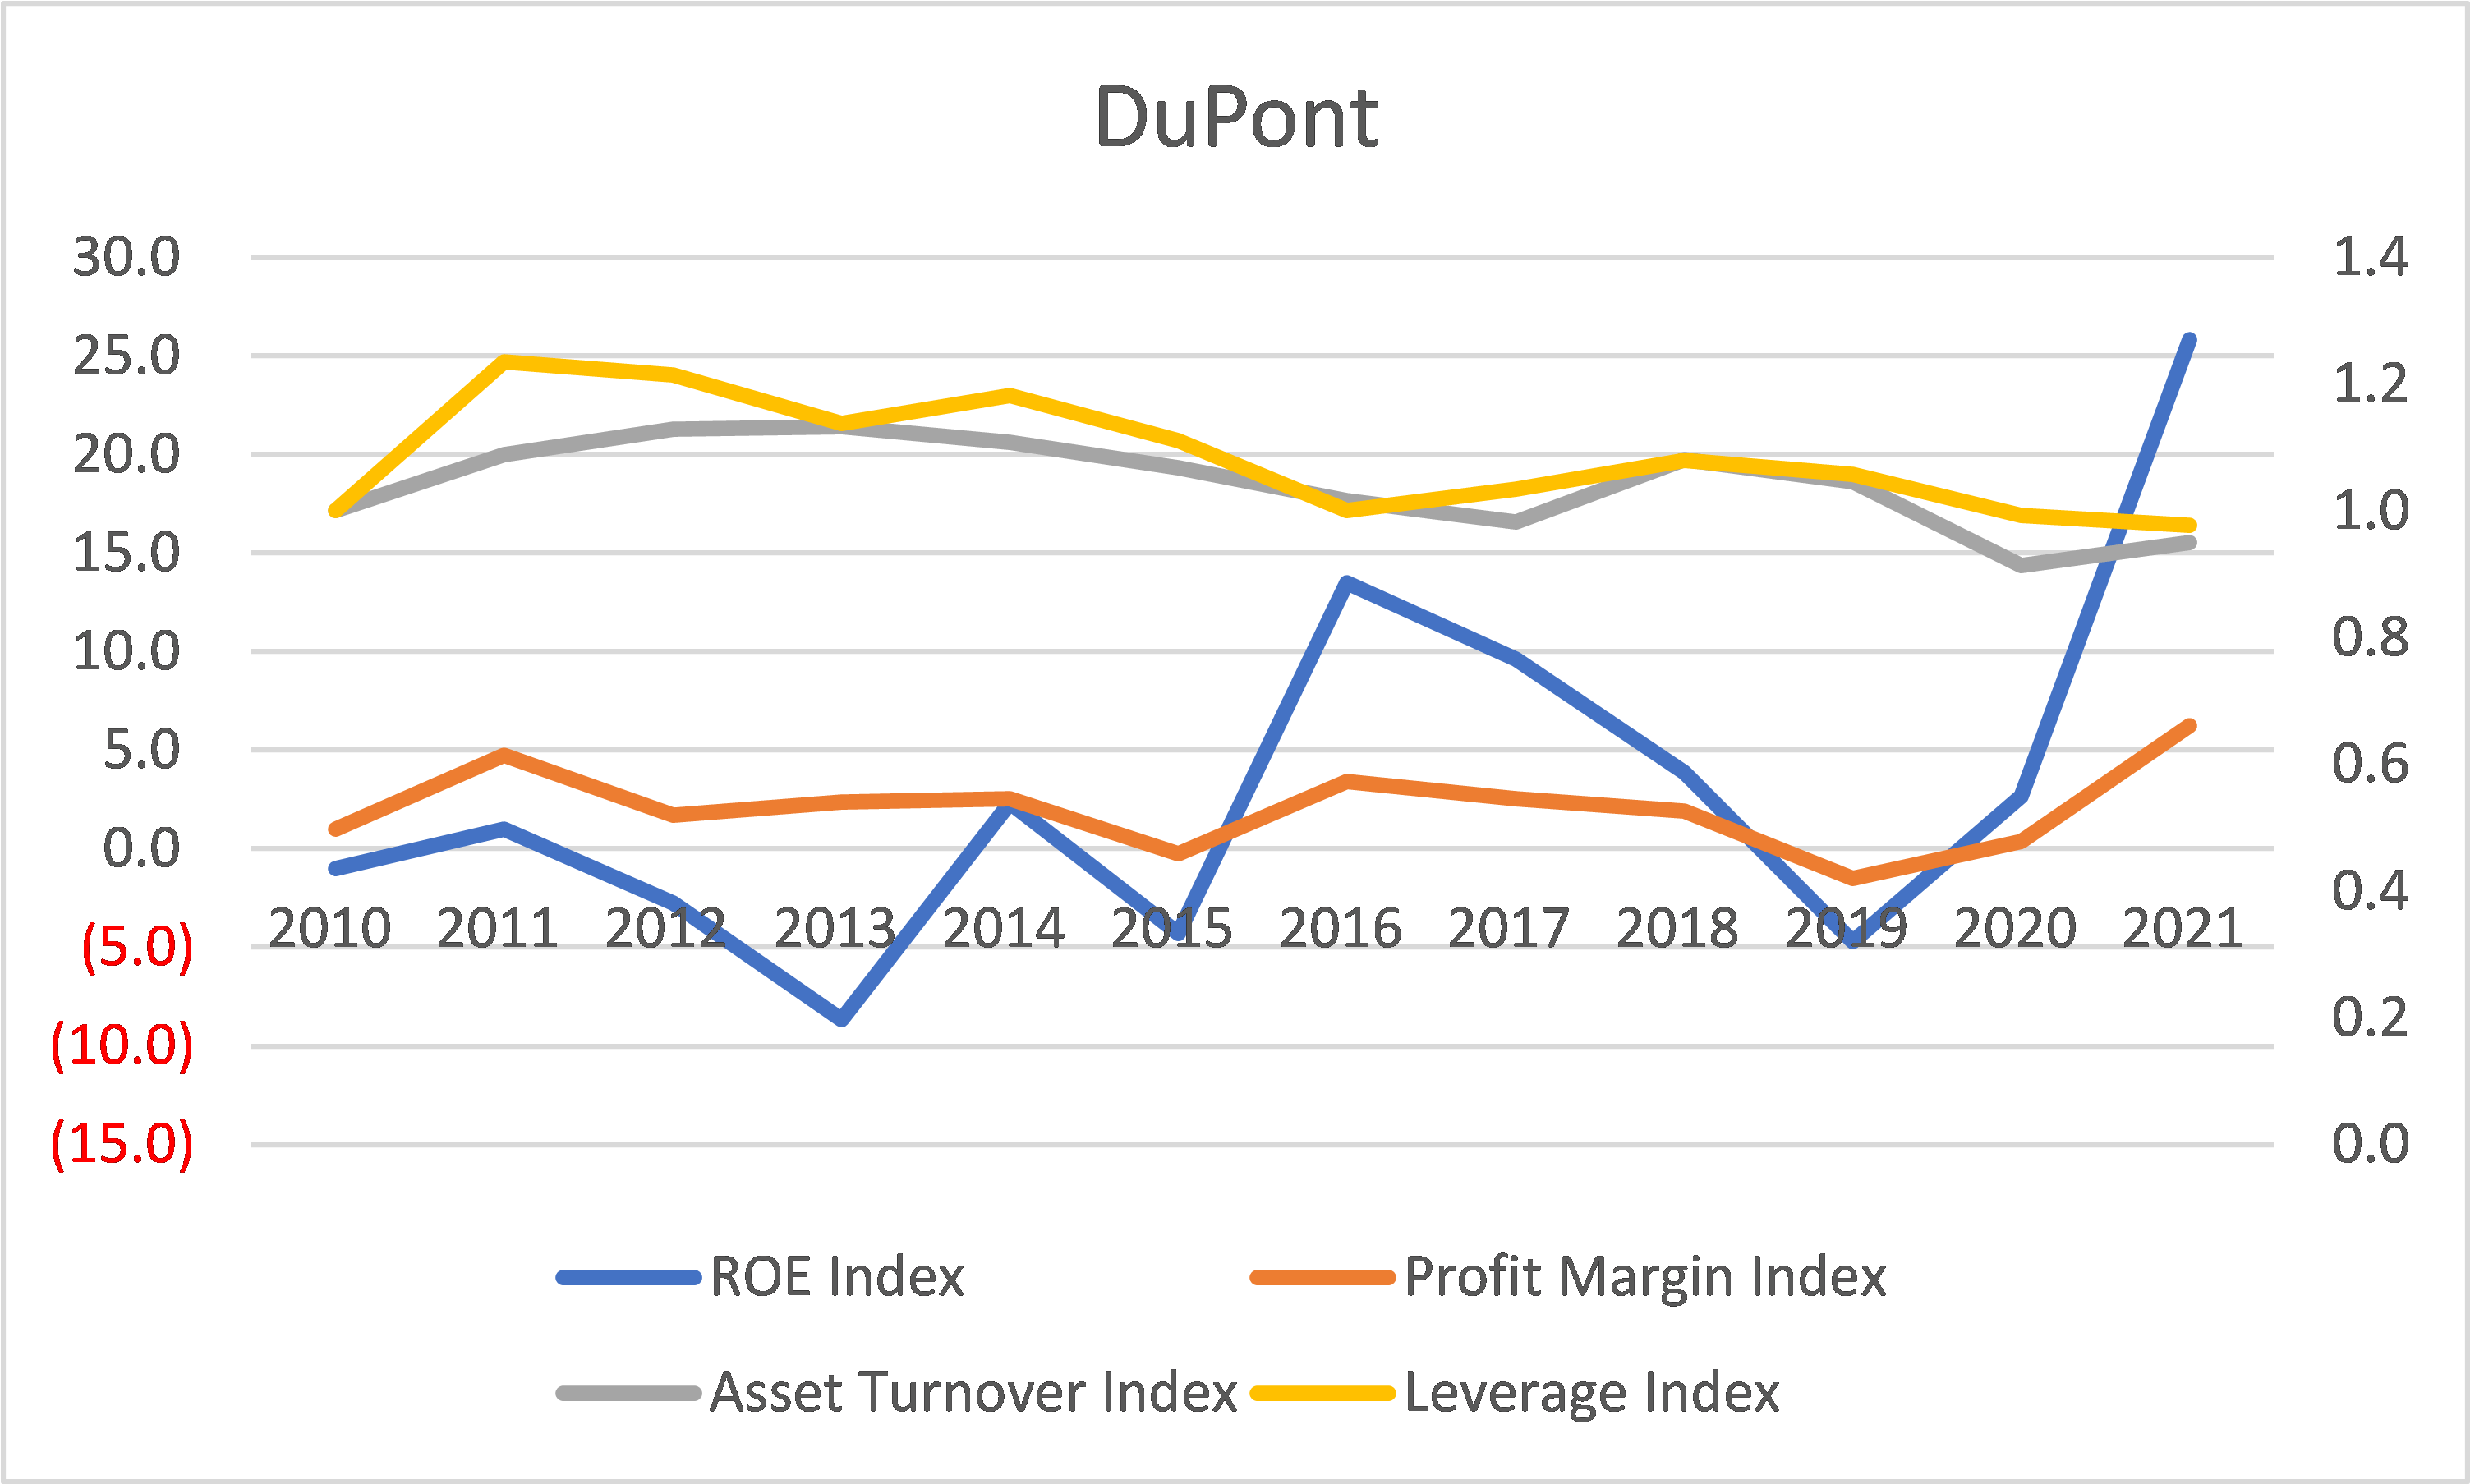
- A DuPont analysis of the ROE for the sector showed that the variation in profit margins accounted for most of the ROE variation.
- The sector is also very conservative when it came to debt. Most of the time, the mean Debt to Equity ratio ranged between 0.6 to 0.8.
I identified 4 companies as candidates for further analysis based on my screen. They are:
 |
| Chart 2: Candidates for further analysis |
Sector background
According to Krungsri Research, the demand for steel products in Thailand will shrink in 2020 compared to 2019. But it will recover in 2021 and grow.
- The demand for hot-rolled coil (HRC), the most important flat steel products, will recover to about 6.3 million tonnes from about 5.7 million tonnes in 2020.
- The demand for steel bars and sections, the most important long steel products should rise by 4.0 % to 5.0% to 3.9 to 4.2 million tonnes per year.
As an investor, you may think that this is augurs well for the steel and metal companies. However, steel is a commodity with cyclical prices.
According to Professor Damodaran, cyclical and commodity companies share a common feature. Their value is often more dependent on the movement of a macro variable - commodity price - than on the firm’s specific characteristics.
Thus, the value of a steel company is linked to the price of steel. The biggest problem in valuing steel companies is that the earnings reported in the most recent year are a function of where they are in the cycle. Extrapolating those numbers into the future can result in wrong valuations.
One way around this is to “normalize” the earnings and cash flows over the cycle. This requires you to have an understanding of the performance over the cycle.
Krungsri Research has a very good write-up on the background on the Thai steel industry so I would suggest that you look it up.
Some key points from the report:
- Most of the players are small and medium-sized enterprises (60% of the total). To reduce risk and to benefit from economies of scale, large producers typically combine steel production and the selling of billet and slab, along with related intermediate products.
- Operators in the steel sector can be divided into two main groups - steel manufacturers and steel traders/importers.
- There is no production of iron in Thailand. Instead, they are imported in the form of pig iron or billets for further processing.
- Steel manufacturers can be grouped in terms of type of production process:
- Manufacturers of slab or billet, most of which are large-sized operators which will also produce finished goods.
- Manufacturers of rebar and structural steel.
- Manufacturers of hot or cold rolled steel.
- Manufacturers of steel piping. Overall, though, the output of most Thai producers is of long products.
- There are some Thai steel producers that imports billets or slabs for further processing into long products or flat products. There are also those that produce billets and slabs from scrap.
- Steel traders and importers are divided into three subgroups:
- Traders in scrap metal and ore (iron and other metals).
- Traders in finished steels, such as rebar and hot and cold rolled steel.
- Traders in steel products such as construction hardware, the largest of these groups.
Cyclical prices
The iron/steel sector is a commoditized cyclical one. Prices are not only cyclical but the prices in different regions move in tandem as illustrated below.
 |
| Chart 3: Steel Prices Source: Steel Benchmarker |
Over the past 12 years, there appear to be at least 2 price cycles. Steel prices in 2021 appear to be in the uptrend part of the price cycle.
Performance
To collect data to serve as base rates I tracked the past 12 years’ performance of the steel and metal companies under SET.
There were 24 companies as of Jan 2022. However, one (GS Steel) is slated for delisting and hence I have left it out. As such whenever I mentioned about sector or industry, I am referring to the performance of these 23 companies.
- Refer to Appendix 1 for the list of these companies.
- Refer to the Methodology section for details on how I computed the various metrics.
- Note that in my charts, the values are millions of Thai Baht (THB)
The profile of the 2021 SHF of these 23 companies are shown in the following chart. Their SHF in 2021 ranged from THB 0.9 billion to THB 14.9 billion with an average of THB 3.7 billion. To give you a sense of the scale, the SET 50 comprises the top 50 companies under SET by market capitalization. The average SHF for the SET 50 companies was THB 114 billion.
 |
| Chart 4: Distribution of 2021 SHF |
Revenue
The mean revenue for the sector exhibited the cyclical nature of the iron and steel industry as shown in the chart below.
From 2010 to 2021, the industry mean revenue grew at CAGR of 3.1 %. While there was a significant decline in mean revenue in 2020, it was not due to the decline in steel prices. You can see what I meant by comparing the revenue profile with that of the HRC price index.
 |
| Chart 5: Revenue Trends |
In a commodity sector, there is a link between the performance of the sector and the commodity prices. The chart illustrated such a link for the Thai steel companies.
PAT
The net income for the sector was very volatile as illustrated by the chart below. Usually, the mean will lie in between the first quartile and the third quartile. You can see that for 2010 to 2013 we have an anomaly. This is because there were a few companies with very large losses during this period. This caused the mean to be very negative and be below the lower quartile.
Over the past 12 years, the sector was only profitable for 7 years (as represented by the sector mean PAT). The results were skewed by the 2021 performance which is very much due to the spike in steel prices.
 |
| Chart 6: Net Income Trends |
Looking at the PAT of individual companies,
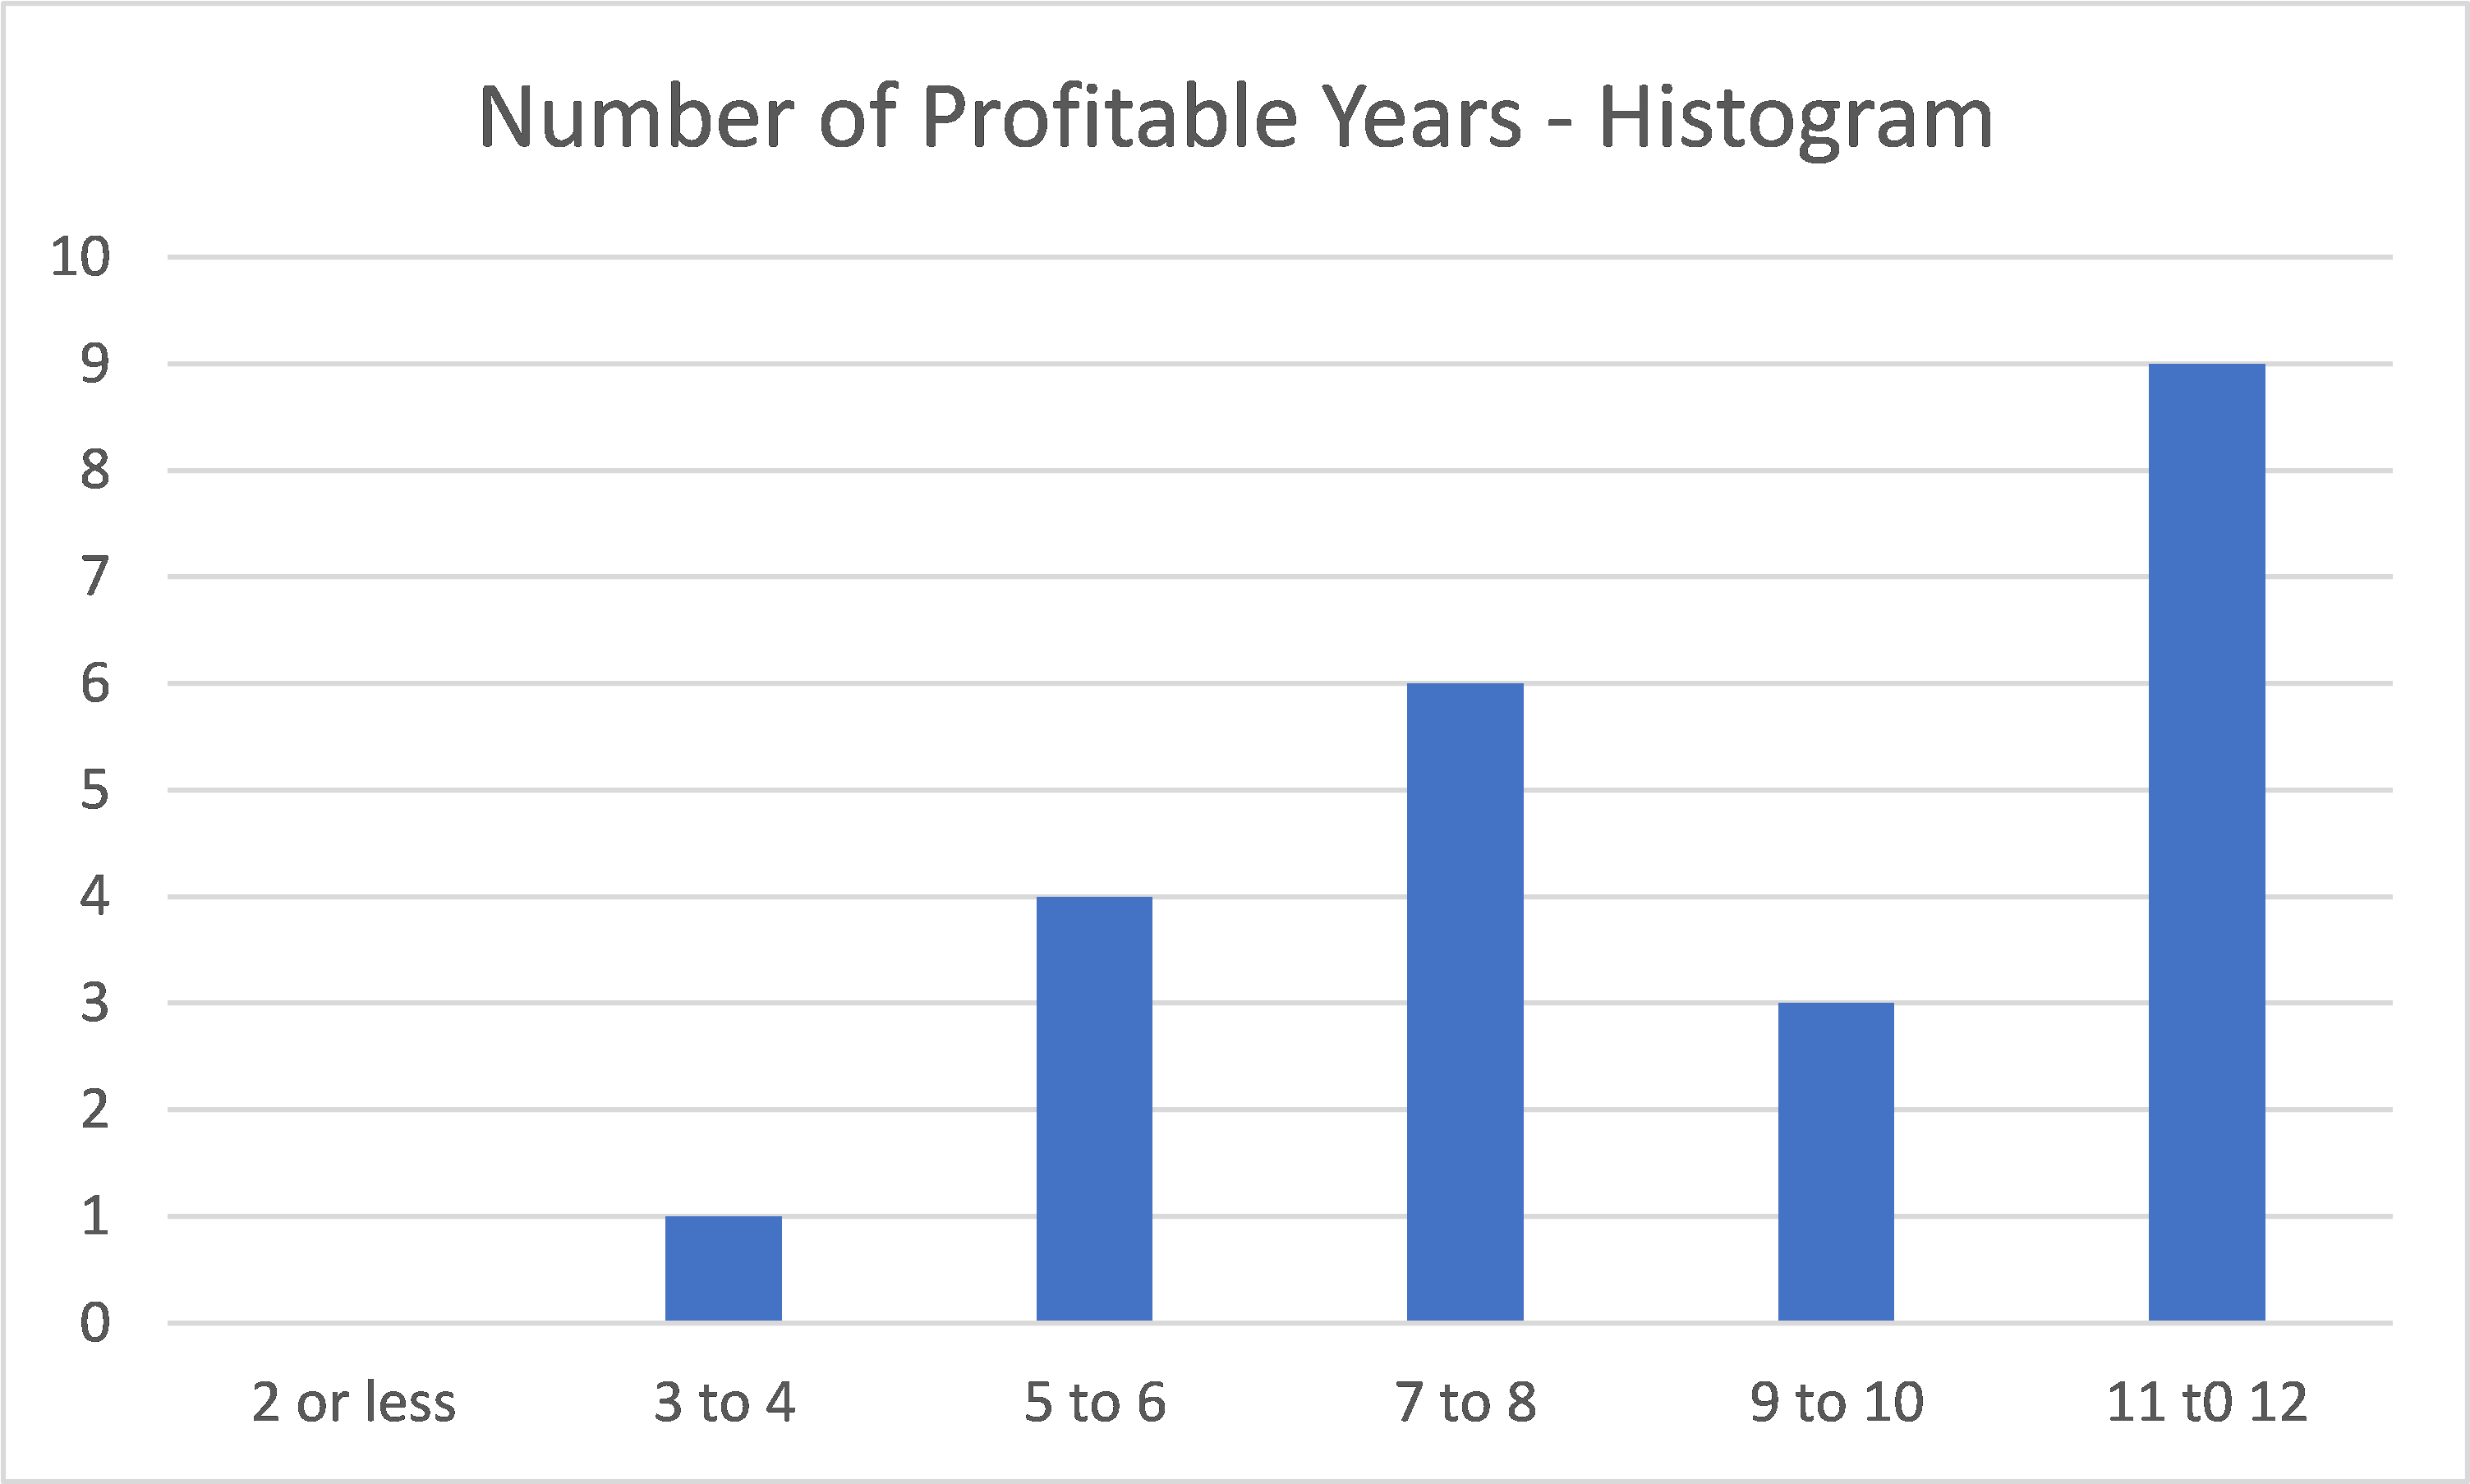
- There were only 6 companies that were profitable every year from 2010 to 2021.
- There were 5 companies that had cumulative losses from 2010 to 2021.
 |
| Chart 7: Distribution of Profitable Years |
Given the PAT volatility, you should not be surprised by the volatility of the Profit Margin as shown below. If nothing else it shows that this is a tough industry to make money.
 |
| Chart 8: PAT Margin Trends |
I have earlier illustrated the impact of steel prices on the sector revenue. The chart below illustrates the link between steel prices and the sector PAT.
 |
| Chart 9: Steel Prices vs Steel Sector PAT |
In practice, the profits of a company will depend on a number of factors. These could be its breakeven levels, the stocks it had when prices changes, and its ability to obtain supplies when the price rises. But the charts do show that profits are influenced by price changes.
Returns
Because of the volatility of PAT, the ROE was also volatile. The sector ROE had been declining since 2010. It was the exceptional profits in 2021 that enabled the sector current ROE to be higher than those in 2010.
 |
| Chart 10: ROE Trends |
I also carried out a DuPont analysis of the mean ROE. The DuPont analysis showed that the main driver for the ROE is actually the Profit Margin. Leverage had declined over the period. But the improvements in the Profit Margin and Asset Turnover more than offset the decline in Leverage.
 |
| Chart 11: DuPont Trends |
Capital structure
The sector mean Equity only grew at a 1.6 % CAGR from 2010 to 2021. Compared to the PAT, the Equity of the sector is relatively stable.
You will notice that for most of the period, the mean Equity was higher than the third quartile Equity. This was because there were a few very large companies that skewed the computation of the mean.
 |
| Chart 12: SHF Trends |
The sector was also very conservative when it came to debt. Most of the time, the mean Debt to Equity ratio ranged between 0.6 to 0.8.
- There was one company with zero Debt for the whole 12 years.
- Only 5 companies had 12 years average Debt Equity ratio of more than 1.
 |
| Chart 13: Debt Equity Trends |
Cash from operations
The cash from operations had a more favourable picture compared to PAT.
- Over the past 12 years, there was only one year where the sector mean cash from operations was negative. Compare this with the sector mean PAT which experienced 5 years of losses.
- I had earlier stated that there were 5 companies that had cumulative losses from 2009 to 2020. Of these 5 companies, 4 actually had positive cumulative cash from operations for the same period.
 |
| Chart 14: Cash flow from Ops Trends |
Gross profitability
Gross profitability is defined as gross profit divided by total assets.
Professor Robert Novy-Max, University of Rochester, has done considerable research into this metric. According to him, it has roughly the same power as book-to-market in predicting the cross-section of mean returns.
 |
| Chart 15: Gross Profitability Trends |
Over the period from 2009 to 2020, the sector had an average gross profitability of 12 %.
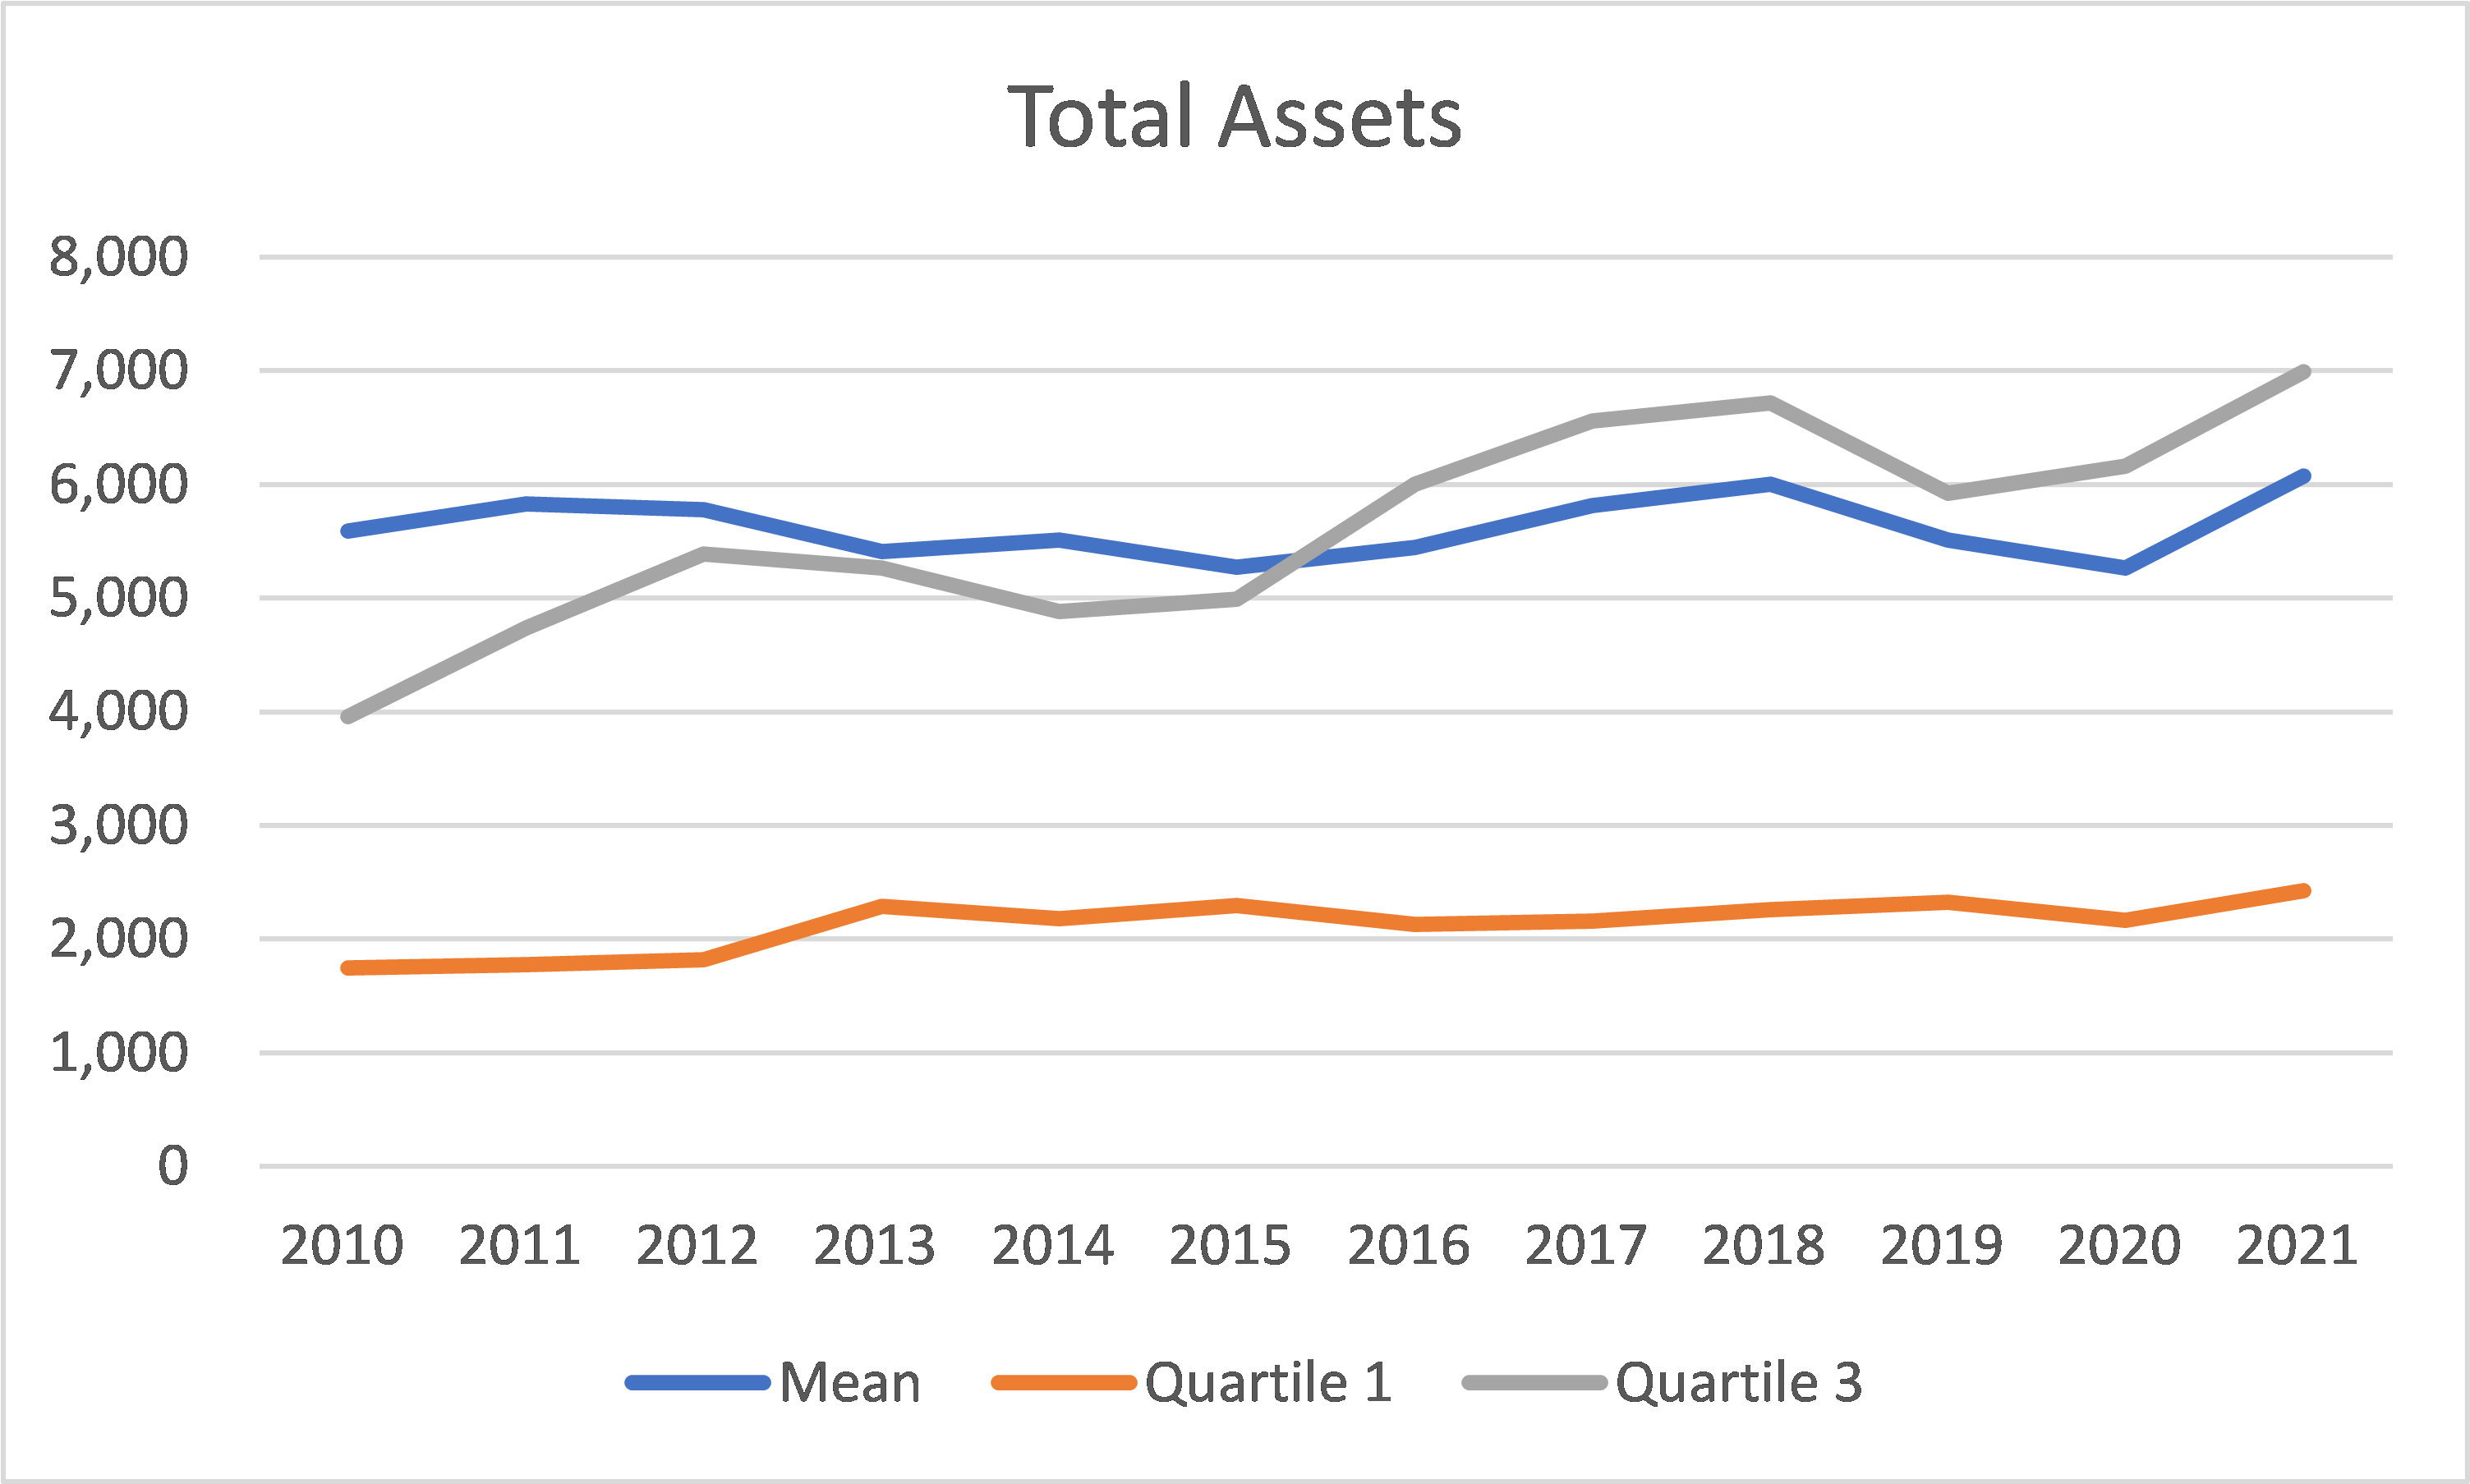
Looking at the profile of the Total Assets, you can see that it is relatively stable. This meant that most of the variation in the gross profitability came from the variation in the gross profit.
 |
| Chart 16: Total Assets Trends |
Screening for opportunities
In the 1990s, I was running a steel pipe and fitting group in Malaysia. My personal experience was that this was a tough industry to be in because of the cyclical nature. The business model was:
- To operate at high utilization rates because of the high fixed cost structure. Given the low domestic demand, this meant exporting at marginal profits.
- To maximize profits during the price uptrend and avoid losses during the price downtrend. Doesn’t this sound like the value investing approach?
You judge the performance by looking at results over the cycle. I have adopted this cyclical view when screening for fundamentally strong companies.
There was are least 2 price cycles over the past 12 years. As such I took the average values from 2010 to 2021 as a good representative of the long-term performance of these companies.
My screening criteria were:
- I hunted for those with cumulative profits over the past 12 years.
- I screened for those with the 12 years average gross profitability > 12%. This was the average of the sector mean values over the past 12 years.
- I screened for those with the 12 years average ROE > 10 %. This was my target return.
- I looked for those trading below the Book Value. In a cyclical sector, Asset Value provides a better picture of the intrinsic value than any earnings multiples. However, at the individual company level, I would complement the Asset Value with EPV.
I set up a simple Excel table to screen for these 4 metrics. The results are shown in the table below. In the table, "1" denoted meeting the metric criteria. A blank denoted that the company failed to meet the criteria. I am looking for companies that met all the 4 criteria.
 |
| Chart 17: Screening Criteria |
There were 4 companies that passed all the 4 criteria. They are:
 |
| Chart 18: 4 Candidates for further analysis |
I am not suggesting that you invest in these 4 companies. Rather I recommend that these 4 companies be candidates for further fundamental analysis if you want to invest in them.
Methodology
I invest in iron and steel companies from a fundamental analysis perspective. As such having information about the industry performance can serve as base rates.
In his book “Thinking Fast and Slow” Daniel Kahneman presented his ideas about the inside and outside view. This is a useful model when analysing companies.
The inside view generally refers to a conclusion reached using an individual own experience and reasoning. It is the perspective of someone looking at the problem from “the inside”. The focus is on the specific situation rather than looking at a broader class of similar situations.
In contrast, the outside view refers to the perspective of someone looking at the problem "from the outside". It is the view taking into consideration the actual experience of other people.
When you analyse a company, the inside view may lead to unrealistic expectations. To counter this, you need an outside view.
This is where base rates come in. The performance of the industry would give you a basis to check on your analysis and projections.
All valuations are based on assumptions and the base rates will help to ensure that the assumptions are realistic.
I hoped you can assess the performance of a particular company with the average and interquartile ranges. If the company is undergoing a turnaround, the base rates would also indicate what is likely.
The data for the base rates were extracted from the Financial Statements for each company for the period 2010 to 2021. Note that it comprised of companies with different financial year ends. For many companies, the 2021 values were the LTM values.
The Financial Statements was taken from a platform/app called TIKR.
I have 2 types of analyses:
- The mean of the sector. This is actually the mean for the 23 companies making up the panel.
- The distribution of individual companies making up the panel. For these, I extracted the quartiles and median for each year based on the ranking of the respective metric for each year.
I have the following example to illustrate the difference between these 2 types of analysis.
Suppose that there are 9 companies in the panel with the Revenue, PAT, and Profit Margin (PAT/Revenue) as shown in the table below.
 |
| Table 1: Sample Panel |
To get the distribution of the Profit Margin, the companies are ranked based on Profit Margin with the results below. Note that they are in descending order.
This is then use to determine the quartile and median values.
 |
| Table 2: Determining Median and Quartiles |
The mean Profit Margin for the sector is derived by dividing the total PAT for the panel by the total revenue for the panel.
Sector mean Profit Margin = 121 / 865 = 14.0 %.
You can also get the mean Profit Margin by adding up individual company Profit Margin (132.3) and dividing by 9 = 14.7 as shown in the table.
There are then 2 mean Profit Margins for the panel.
- The 14.0 % is looking at the performance of the panel as a whole.
- The 14.7 % is looking at the distribution of individual profit margins.
The values are different because we are looking from different viewpoints. In my analysis I am more interested in the former.
Appendix 1
The list of companies covered in the analysis were those in the steel and metal sector as defined by SET.
There were 24 companies identified. However, one (GS Steel) is slated for delisting and hence I have left it out. As such whenever I mentioned about sector or industry, I am referring to the performance of these 23 companies.
List of companies covered in analysis as per their SET symbols:
End
- - - - - - - - - - - - - - - - - - - - - - - - - - - - - - - - -
How to be an Authoritative Source, Share This Post
|
Disclaimer & Disclosure
I am not an investment adviser, security analyst, or stockbroker. The contents are meant for educational purposes and should not be taken as any recommendation to purchase or dispose of shares in the featured companies. Investments or strategies mentioned on this website may not be suitable for you and you should have your own independent decision regarding them.
The opinions expressed here are based on information I consider reliable but I do not warrant its completeness or accuracy and should not be relied on as such.
I may have equity interests in some of the companies featured.
This blog is reader-supported. When you buy through links in the post, the blog will earn a small commission. The payment comes from the retailer and not from you.


I am really happy to say it’s an interesting post to read. I learned new information about Trusted Caustic Soda Supplier in Saudi Arabia from your post, you are doing a great job. Keep it up.
ReplyDeleteThis comment has been removed by the author.
ReplyDelete