Making sense of the Bursa Malaysia construction sector
Case Notes 19. This article looked at the Bursa Malaysia construction companies and identified the better companies for further investigation. It also compiled the base rates for the construction sector.
“…there is a strong correlation between the construction sector and economic growth of Malaysia…”. Malaysian Construction Sector and Malaysia Vision 2020: Developed Nation Status”. This was presented at 2nd World Conference on Business, Economics and Management, 2013
That conclusion was based on the time series data for the construction sector and economic growth of Malaysia from 1991 to 2010. However, when you looked at the following 2 charts from 2012 to 2020, you may be forgiven for questioning this link.
Chart 1: GDP Source: Trading Economics
 |
| Chart 2: Construction Output Source: Trading Economics |
The charts seemed to indicate that the performance of the construction industry had declined over the past decade while GDP grew. I wanted to see the impact of this divergence on the Bursa Malaysia construction companies.
I analyzed 40 Bursa Malaysian companies (the "panel") under the construction sector. I found that from 2010 to 2021, the mean revenue of the panel grew at a CAGR of 1.1 %. In contrast, the Malaysian GDP for the same period grew at 3.9 % CAGR. At the same time, the mean ROE of the panel had also declined from 2010 to 2021.
You may think that with such dismal performance, there will not be any investment opportunities in this sector. But I identified 3 companies with good fundamentals that were trading below their respective Book Values.
Should go and buy them? Read my Disclaimer.
Contents
- Sector background
- Performance
- Screening for opportunities
- Methodology
- Appendix
|
Sector background
The Malaysian construction industry contributed between 3 % to 5 % to the Malaysian economy.
According to Mordor Intelligence the Malaysian construction industry had been affected by Covid-19. The industry's output had shrunk. Construction activity was brought to a standstill across many parts of the country, owing to the containment measures.
In Jun 2020, the Construction Industry Development Board inspected 6,750 construction sites. Of these, 5,000 were not yet operational. In 2020, the value of construction work done contracted by 19.4% to RM117.9 billion as compared to RM146.4 billion in 2019.
However, it is all not doom and gloom as the sector is expected to rebound and grow.
According to Business Wire,
- The Malaysian construction industry is expected to register an annual average growth rate of 6.8% between 2022 and 2025. Over the forecast period, growth will be driven by investments in transportation and energy projects.
- In June 2021, the government unveiled its energy transition plans until 2040. This aims to increase the proportion of renewable energy in the total energy mix from 2% in 2019 to 31% by 2025, and 40% by 2035.
- In September 2021, the government announced its Public Private Partnership (PPP) 3.0 model to fund infrastructure projects.
- Over the forecast period, the industry's growth will also be supported by a recovery in economic conditions. This would be coupled with investment in residential, industrial and water infrastructure projects.
Performance
To collect base rates data, I tracked the past 12 years’ performance of the construction companies under the Main Board of Bursa Malaysia. There were 52 companies in the construction sector as of Jan 2022.
However, only 40 of them had readily available financial data from 2010 to 2021. As such whenever I mentioned about sector or industry, I am referring to the performance of these 40 companies.
- Refer to Appendix 1 for the list of these companies.
- Refer to the Methodology section for details on how I computed the various metrics.
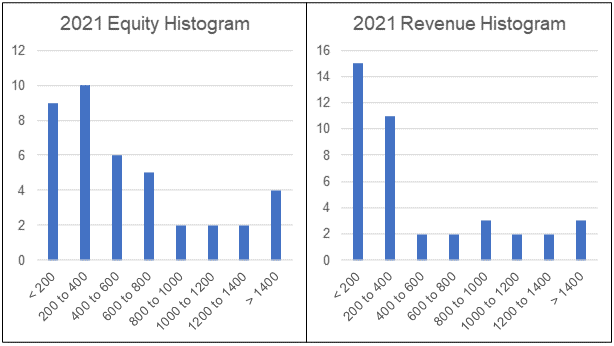
The profiles of these 40 companies are shown in the following charts.
 |
| Chart 3: Profile of Panel |
The 2021 SHF of the panel ranged from RM 50 million to RM 10.8 billion with an average of RM 1.1 billion. To give you a sense of the scale, the average SHF for the KLCI component companies was about RM 22 billion.
The revenue of the panel in 2021 ranged from RM 5 million to RM 5.6 billion with an average of RM 640 million. In contrast, the average revenue of the KLCI component companies was about RM 13 billion.
You will notice that the SHF and revenue for the majority of the panel companies were smaller than the industry average.
The sector had a very challenging performance over the past 12 years.
- The sector mean revenue only grew at 1.1 % CAGR while the sector mean PAT declined at a compounded 3.8 % per annum. Not surprisingly, the sector ROE had been declining over the past 12 years. This decline began pre-Covid-19.
- The average SHF of the sector grew from 2010 to 2021. At the same time, the sector Debt also grew but at a faster rate so that the sector average Debt Equity ratio in 2021/2020 was higher than that in 2010.
- The silver lining for the sector was that the mean cash from operations in 2021 was higher than that for 2010. The cash flow trends seemed to be positive compared to the PAT trends.
Details of the sector performance are presented in the following sections.
Revenue
During the early part of the past decade, the industry average revenue seemed to track Malaysia’s GDP growth. Covid-19 seemed to have changed the picture. The industry revenue declined in 2020 due to the pandemic measures along the same lines as the economy. While the economy was projected to turnaround in 2021, the construction sector performance got worse. Note that 2021 industry revenue was based on the Sept LTM revenue.
 |
| Chart 4: Revenue compared with GDP |
From 2010 to 2021, the industry mean revenue grew at CAGR of 1.1 %. In comparison, the Malaysian economy grew at 3.9 % CAGR during the same period.
But the construction sector overall growth rate does not tell the full story. From 2010 to 2019, the industry mean revenue grew at 3.9 % CAGR. It was the pandemic measures that cause the drastic decline. From 2019 to 2021, the industry mean revenue contracted at a compounded rate of 10.5 %.
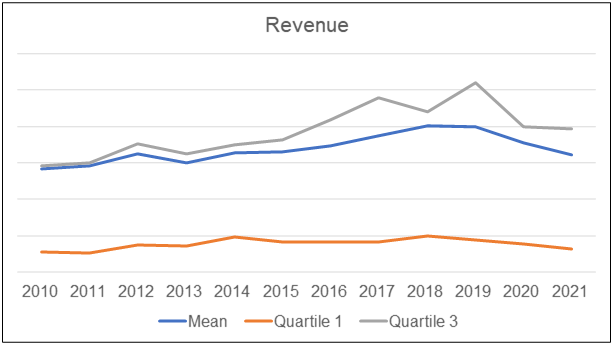 |
| Chart 5: Revenue trends |
The other unusual characteristics of the industry profile can be seen from Chart 5. In many sectors, the mean values would lie somewhere in the middle of the interquartile ranges. But in the case of the construction sector, the mean is very near the third quartile values. It is skewed in this manner because of the relatively large revenues of a few big companies. You should not be surprised given the revenue histogram as shown in Chart 3.
You will note that the revenue trends of these Bursa Malaysian construction sector relative to the GDP were very different from the overall construction output as shown in Chart 2.
PAT
The net income for the sector was very volatile as illustrated by Chart 6. I had earlier mentioned the unusual characteristic of the mean being close to the third quartile. In the case of PAT, for the first half of the decade, the mean PAT was above the third quartile. The profits of the few large companies had very significant impact on the industry mean profits.
The sector mean PAT had been declining since 2015. This decline started long before Covid-19 and 2020 made it worst. Although 2021 was better than 2020, the industry mean PAT in 2021 was lower than that in 2010.
We see the same trends for the first and third quartiles. Chart 6 showed that in 2020 and 2021, about ¼ of the panel was not profitable.
 |
| Chart 6: PAT Trends |
Looking at the PAT of individual companies,
- There were 13 companies that were profitable every year from 2010 to 2021.
- There were 11 companies that had cumulative losses from 2010 to 2021. This meant that their equity actually shrank from 2010 to 2021.
If nothing else, it demonstrated that this was a tough sector to make money.
Returns
Because of the declining PAT, the ROE was also declining. In the first half of the decade, the sector mean ROE for many years can be considered to be comparable to that of 2010. But thereafter it began to decline so by 2019 (before the pandemic) it was already lower than that in 2010. Of course, the pandemic caused it to go into negative territory in 2020 and 2021.
 |
| Chart 7: ROE Trends Note: I have excluded the ROE in 2010 for Puncak Niaga. This was because of a reduction in the Equity following new and amended FRS and IC Interpretations. |
I also carried out a DuPont analysis of the sector mean ROE. The DuPont analysis showed that the decline in the ROE was due to the decline in the Profit Margin and Asset Turnover.
 |
| Chart 8: DuPont Analysis Trends Note: I have excluded the ROE and Leverage in 2010 for Puncak Niaga. This was because of a reduction in the Equity following new and amended FRS and IC Interpretations |
Capital structure
The sector mean Equity grew at 8.6 % CAGR from 2010 to 2021. Given this growth together with the declining PAT, you should not be surprised to find that the ROE had been declining.
You will notice that the mean Equity was higher than the third quartile Equity. This was because there were a few very large companies that skewed the computation of the mean.
 |
| Chart 9: SHF Trends |
Chart 10 showed the Debt Equity profile of the sector.
- 60% of the panel had a higher Debt Equity in 2021 compared to their respective Debt Equity in 2010.
- There mean Debt Equity in 2021 was 1.3 compared to the mean Debt Equity of 0.9 in 2010. Given the growth in the SHF, I would interpret this as the sector Debt increasing faster than the sector SHF.
 |
| Chart 10: DE Trends Note: I have excluded the ROE and Leverage in 2010 for Puncak Niaga. This was because of a reduction in the Equity following new and amended FRS and IC Interpretations |
Cash from operations
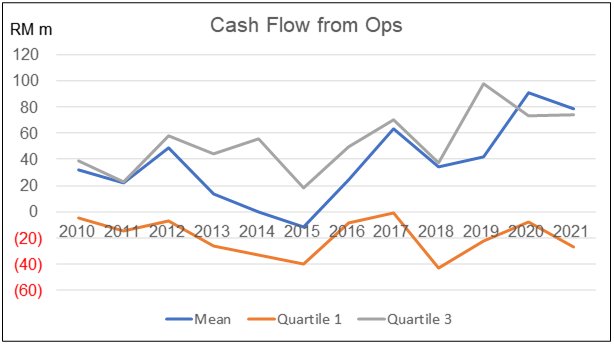
The cash from operations had a more favourable picture compared to PAT. The mean cash from operations in 2021 was higher than that for 2010. The cash flow trends seemed to be positive compared to the PAT trends.
However, it was not all rosy because 1/3 of the panel had negative cumulative cash flow from operations from 2010 to 2021.
 |
| Chart 11: Cash Flow from Ops Trends |
Gross profitability
Gross profitability is defined as gross profit divided by total assets.
Professor Robert Novy-Max, University of Rochester, has done considerable research into this metric. According to him, it has roughly the same power as book-to-market in predicting the cross-section of mean returns.
Over the period 2010 to 2020, the sector had an average gross profitability of 9 %. But it was a declining trend. If you follow the Novy-Max concept, this meant that the industry returns in the immediate future is not going to be rosy.
 |
| Chart 12: Gross Profitability Trends |
Screening for opportunities
When you look at the Malaysian GDP over the past 12 years, you can see that it had experienced 2 cycles. As such when looking for investment opportunities, it may be more sensible to look at the long-term performance of these companies.
I thus used the following criteria to screen for investment opportunities among the Bursa Malaysia construction companies:
- I hunted for those that were profitable every year over the past 12 years.
- I screened for those with 12 years average gross profitability > 9%. This was the average of the sector mean values over the past 12 years.
- I screened for those with 12 years average ROE > 10 %. This is my target return.
- I looked for those trading below the Book Value. In a downtrend situation, Asset Value provides a better picture of the intrinsic value than any earnings multiples.
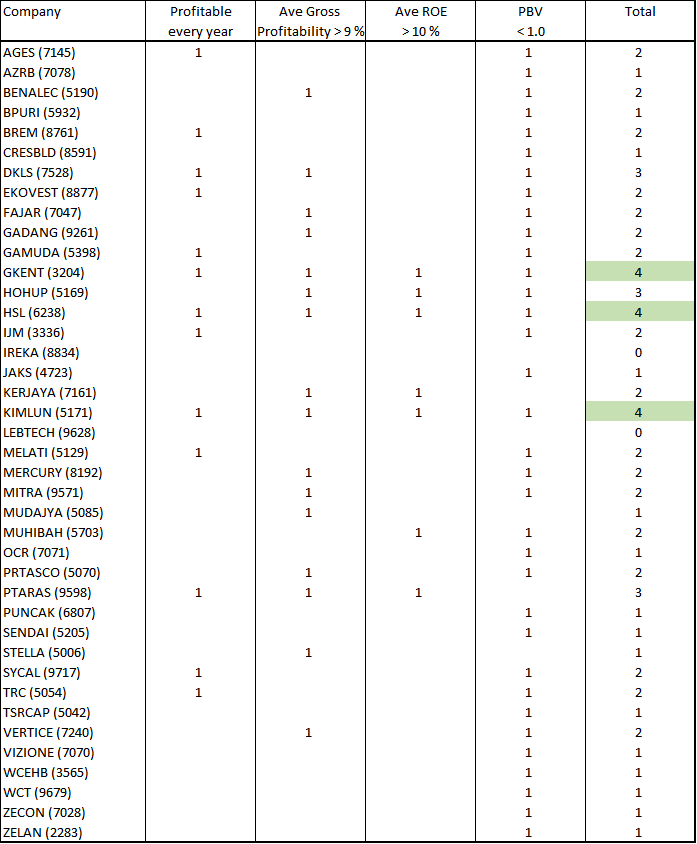
I set up a simple Excel table to screen for these 4 metrics. The results are shown in the table below. In the table, 1 denoted meeting the metric criteria. A blank meant that the company failed to meet the criteria. I am looking for companies that met all the 4 criteria.
 |
| Table 1: Screen for Investment Opportunities |
There were 3 companies that pass all the 4 criteria as highlighted in green in Table 1. They are:
|
Company |
Profile |
|
GKENT |
An engineering company. It constructs
rail transportation, water supply infrastructure, and hospital projects in
Malaysia. It operates through three segments: Engineering, Metering, and
Others.
|
|
HSL |
Operates as a marine engineering,
civil engineering, and construction company in Malaysia. It operates in two
segments, Construction and Property Development. |
|
KIMLUN |
Provides engineering and construction
services in Malaysia and Singapore. It operates through 4 segments - Construction,
Manufacturing and Trading of Construction Materials, Provision of Quarry
Services, and Property Development.
|
Table 2: Profile of screened Companies
I am not suggesting that you invest in these 3 companies. Rather I recommend that these 3 companies be candidates for further fundamental analysis if you want to invest in them.
Methodology
In his book “Thinking Fast and Slow” Daniel Kahneman presented his ideas about the inside and outside view. This is a useful model when analysing companies.
The inside view generally refers to a conclusion reached using an individual own experience and reasoning. It is the perspective of someone looking at the problem from “the inside”. The focus is on the specific situation rather than looking at a broader class of similar situations.
In contrast, the outside view refers to the perspective of someone looking at the problem "from the outside". It is the view taking into consideration the actual experience of other people.
When you analyse a company, the inside view may lead to unrealistic expectations. To counter this, you need an outside view.
This is where base rates come in. The performance of the industry would give you a basis to check on your analysis and projections.
All valuations are based on assumptions and the base rates will help to ensure that the assumptions are realistic. I hoped you can assess the performance of a particular company with the average and interquartile ranges.
The data for the base rates were extracted from the Financial Statements for each company for the period 2010 to 2021. Note that it comprised of companies with different financial year ends. For many companies, the 2021 values were the LTM values.
The Financial Statements was taken from a platform/app called TIKR.com *
I have 2 types of analyses:
- The mean of the sector. This is actually the mean for the 40 companies making up the panel.
- The distribution of individual companies making up the panel. For these, I extracted the quartiles and median for each year based on the ranking of the respective metric for each year.
I have the following example to illustrate the difference between these 2 types of analysis.
Suppose that there are 9 companies in the panel with the Revenue, PAT, and Profit margin (PAT/Revenue) as shown in the table below.
 |
| Table 3: Sample Data |
To get the distribution of the Profit margin, the companies were ranked based on profit margin with the results below. Note that they are in descending order.
This was then use to determine the quartile and median values.
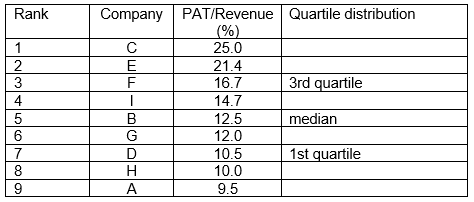 |
| Table 4: Sorted Data |
The mean profit margin for the sector was derived by dividing the total PAT for the panel by the total revenue for the panel.
Sector mean profit margin = 121 / 865 = 14.0 %.
You can also get the mean profit margin by adding up individual company profit margin (ie 132.3) and dividing by 9 = 14.7 as shown in the table.
There are then 2 mean profit margins for the panel.
- The 14.0 % is looking at the performance of the panel as a whole.
- The 14.7 % is looking at the distribution of individual profit margins.
The values are different because we are looking from different viewpoints. In my analysis I am more interested in the former. Note for this article, I did not use the median values.
Base rates details
The information on the base rates presented in this article is a summary of the various metrics. There is actually a lot of details with me. Different investors look for different things when analysing companies. As such if you need specific details, do feel free to contact me at i4valueasia@gmail.com.
For a fundamental investor, base rates are important as they help ensure that the assumptions used in the analysis and valuations are realistic. If you do not have such information but still want to invest based on fundamentals, one way is to rely on third-party analysis and valuation.
There are several financial advisers who provide such analyses.
Those who do this well include people like Seeking Alpha.* Click the link for some free stock advice. If you subscribe to their services, you can tap into their business analysis and valuation.
Appendix 1
The companies covered in the analysis were those under the Bursa Malaysia construction sector. Altogether there were 62 companies comprising
- 7 under the ACE Board.
- 3 under the LEAP Board.
- 52 under the Main Board.
My focus was on the Main Board companies. However, of these 52 companies, there were 12 that did not have the full financials from 2010 to 2021. Thus, my analysis only covered 40 companies. Whenever I mentioned about panel, sector or industry, I am referring to the performance of these 40 companies.
The list of companies covered in analysis as per their Bursa Malaysia symbols are:
End
- - - - - - - - - - - - - - - - - - - - - - - - - - - - - - - - -
How to be an Authoritative Source, Share This Post
|
Disclaimer & Disclosure
I am not an investment adviser, security analyst, or stockbroker. The contents are meant for educational purposes and should not be taken as any recommendation to purchase or dispose of shares in the featured companies. Investments or strategies mentioned on this website may not be suitable for you and you should have your own independent decision regarding them.
The opinions expressed here are based on information I consider reliable but I do not warrant its completeness or accuracy and should not be relied on as such.
I may have equity interests in some of the companies featured.
This blog is reader-supported. When you buy through links in the post, the blog will earn a small commission. The payment comes from the retailer and not from you.


Comments
Post a Comment