Is there an “Evergrande” among Bursa property stocks? (Part 2 of 2)
Case Notes 15-2. In Part 1, I used the seven red flags to screen for potential Evergrande among Bursa Malaysia property companies. While none matched all the 7 criteria, 3 companies had more than 5 red flags. This Part 2 dug deeper into Evergrande's financials and those of the 3 companies.
The goal of the Evergrande analysis was to see whether I could identify benchmarks that could be used as red flags.
Such red flags would be useful to stock investors looking at investing in Malaysian property companies. They could also be used by house buyers as part of their due diligence process.
The focus was on the retail investors and/or house buyers. As such the red flags should not need the person to be a forensic accountant or to dig deeply into the financial statements. I thus looked at metrics that were based on information readily available from online investment portals.
I started the study by reviewing the various reports on Evergrande carried out by other analysts. Based on these, I identified the key issues faced by Evergrande and the appropriate metrics to track them.
I then tracked the performance of Evergrande from 2010 to 2020 using these metrics. I also compared the performance of 85 companies under the Bursa Malaysian property sector with that of Evergrande.
The results were 7 metrics that could be used as red flags. I also found that none of the 85 Bursa Malaysia property companies met these 7 red flags criteria. In other words, there was no Malaysian Evergrande. But there were 3 companies that came close.
All these were reported in Part 1 of this series. For details of the Methodology refer to Part 1.
In Part 2 here, I will explore further the performance of Evergrande to understand how it got into problems. I will also further analyze the 3 companies that came close to being Malaysian Evergrande. These were the ones that met at least 5 of the 7 Evergrande’s red flags.
Contents
- Summary
- Roots of Evergrande’s Problems
- Performance comparisons
- Malaysian companies with substantial red flags
This blog is reader-supported. When you buy through links in the post, the blog will earn a small commission. The payment comes from the retailer and not from you. Learn more. |
Summary
- Evergrande’s problem is more about liquidity than solvency. It got into trouble because it funded its growth with Debt. Yet while growing it had a declining ROE. It did not help that it did not have a good track record of generating cash flow from operations.
 |
| Chart 1: Evergrande Performance |
- A DuPont analysis of Evergrande’s ROE showed that the declining ROE was the result of declining Profit margins and Asset Turnover. The increase in Leverage could not offset these declines resulting in a declining ROE.
 |
| Table 1: DuPont Analysis |
- Compared to the Malaysian property companies, Evergrande average Leverage stood out. But its Profit Margin and Asset Turnover were not exceptional relative to Malaysian ones.
- In Part1, I had found that there was no Malaysian property company that met the 7 red flags criteria. But there were 3 companies that scored 5 or more out of these 7 metrics.
- But my analysis showed that these 3 companies are not likely to go Evergrande’s way. This was because:
- Unlike Evergrande, these 3 did not have revenue growth. Their inventory, payables, and even cash flow problems can be attributed to the lack of revenue growth.
- Secondly, Evergrande’s liquidity problem is due to its high Debt levels with an average Debt Equity of 2.00. The 3 Malaysian companies' average Debt Equity ratios are significantly less.
In Part 1, I concluded that the Malaysian property companies are resilient because none met all of Evergrande’s 7 red flags criteria. The analysis of the 3 companies reinforces the resilient picture. This is unlike the 90s during the Asian Financial Crisis when several property companies had to be restructured.
Roots of Evergrande’s Problems
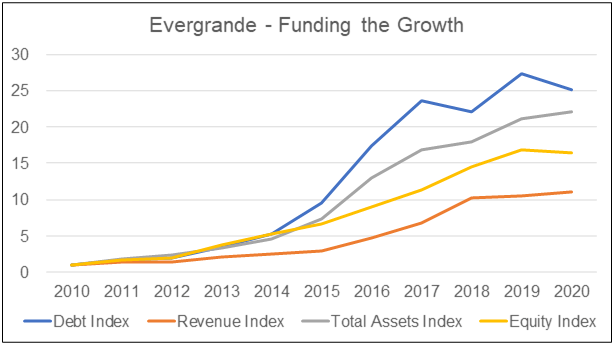
The analysis in Part 1 showed that Evergrande is facing a liquidity problem rather than a solvency problem. It got into this position because it relied on Debt to fund its growth. This is illustrated by the chart below.
This is not even considering the off-Balance Sheet liabilities. At the same time, some of its payables are actually “disguised” debt.
 |
| Chart 2: Evergrande - Growth |
The worst part is that while getting bigger, Evergrande returns and cash generation got worst.
- Evergrande ROE declined by about 13 % annually. As will be shown later, Evergrande’s declining ROE was basically due to declining Profit Margins and Asset Turnover.
- Cash flow from operations was negative in most years. The positive results in 2018 and 2020 appeared to be from changes in working capital.
 |
| Chart 3: Evergrande Return and Cash Flow from Ops |
Given this picture, you should not be surprised by Evergrande's current situation. The problem was hidden when the Chinese property market was booming and credit was readily available. But when the property market got soft, Evergrande liquidity problems surfaced. This was made worse when the Chinese authorities also began to control borrowings.
The Wall Street Journal summed up the situation as follows:
“Problems started to emerge last year when pandemic lockdowns hurt property sales for months, and they snowballed into concerns about a cash crunch last fall. Meanwhile, China’s efforts to crack down on borrowing by real-estate developers via limits known as the “three red lines” kept the company from taking on new debt.”
In Part 1, I identified 3 companies that met at least 5 out of 7 red flags. Did these 3 companies also have a debt-funded growth with deteriorating ROE and poor cash generation? If so, given the soft Malaysian property market, they are potential Evergrande.
Performance comparisons
In Part 1, I focussed on those metrics that reflected the negative traits of Evergrande. In Part 2 here, I will look at other commonly used performance metrics.
The analysis here will illustrate that Evergrande got into trouble because of its own operational issues.
Revenue
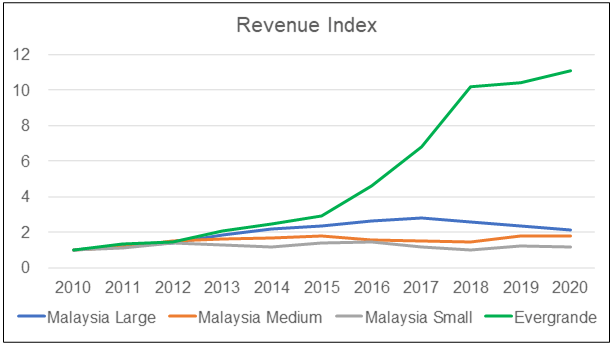
Without a doubt, Evergrande dollar revenue would tower over those of the Malaysian companies. In 2020, Evergrande achieved USD 78 billion in revenue. This was about 78 times larger than the largest Malaysian property company revenue. Among the Malaysian panel, SP Setia had the largest revenue in 2020 with about USD 1 billion revenue.
 |
| Chart 4: Revenue |
But it was the growth rate that stood out. Evergrande revenue had grown by 23 % annually from 2010 to 2020.
 |
| Table 2: Revenue Growth |
At the individual Malaysian company level, there were 4 companies that achieved more than 23 % annual growth in revenue from 2010 to 2020.
Profits
It is obvious that in terms of dollar profits, Evergrande with a PAT of USD 4.8 b in 2020 would overshadow the Malaysian companies. However, when you looked at PAT growth,
- Evergrande PAT grew by 16 % annually between 2010 and 2020.
- There were 18 Malaysian property developers with a growth rate that exceeded that of Evergrande during the same period.
 |
| Chart 5: PAT |
As can be seen from the PAT Index chart, the Evergrande PAT growth rate was not something exceptional. Of course, some of the Malaysian companies had more than a 16% annual growth rate because they started from a small base.
 |
| Table 3: PAT and Revenue parameters |
The point to note is that profit growth was smaller than revenue growth. You would have thought that as revenue grew, the fixed costs as a % of revenue would come down thereby improving profitability. We do not see this in Evergrande. In fact Selling, General, and Admin Expenses (SGA) as a % of revenue grew from 6.5 % in 2020 to 10.5 % in 2020.
Returns
In terms of ROE, Evergrande outperformed the average ROE of the 3 groups of Malaysian property companies.
- Evergrande had an average ROE of 19 % from 2010 to 2020. Among the 3 Malaysian groups, the best ROE was from the Large group that had an average ROE of 9 % for the same period.
- There was actually one Malaysian company - Matrix Concepts Holding Bhd - that had an average ROE from 2010 to 2020 that exceeded 19 %.
 |
| Chart 6: ROE |
But as can be seen from the chart, the ROE of Evergrande had been declining since 2010. In 2010, Evergrande had an ROE of 38%. This had shrunk to 9 % by 2020. This is equal to an annual decline of 13 %.
- There were 30 Malaysian companies where the ROE declined by more than 13 % annually during the same period.
- There were 15 Malaysian companies that buck the trend with increasing ROE in 2020 compared to those in 2010. Do not confuse this with the 55 that did better than Evergrande as shown in the table. I defined “better” as having a trend that is more than (13 %). A negative trend of 5 % is deemed better even though it is not positive growth.
 |
| Table 4: ROE parameters |
When it came to ROA, Evergrande's return did not stand out. As can be seen, Evergrande only outperformed the average ROA of the Large Malaysian group in 2010 and 2011.
In fact, for 4 years, even the Medium Malaysian group ROA exceeded those of Evergrande.
 |
| Chart 7: ROA |
In terms of ROA trends, Evergrande and the averages of the 3 Malaysian groups had declining ROA.
There were 19 Malaysian companies that bucked the trend by having the 2020 ROA greater than those of 2010.
 |
| Table 5: ROA parameters |
DuPont analysis
I also carried out a DuPont analysis of the ROE. The Dupont analysis is an expanded ROE formula calculated as follows:
ROE = PAT / Equity
= (PAT / Revenue) X (Revenue / Total Assets) X (Total Assets / Equity)
= Profit Margin X Asset Turnover X Leverage
The analysis showed that are three major financial metrics that drive ROE. These are operating efficiency, asset use efficiency, and financial leverage.
- Operating efficiency is represented by the profit margin. It indicates the amount of net income generated per dollar of sales.
- Asset use efficiency is measured by the asset turnover ratio and represents the sales amount generated per dollar of assets.
- Leverage is measured by the equity multiplier.
 |
| Table 6: DuPont Analysis |
You can see that Evergrande's average Leverage stood out. But its Profit Margin and Asset Turnover were not exceptional relative to Malaysian ones.
 |
| Chart 8: DuPont Analysis Index |
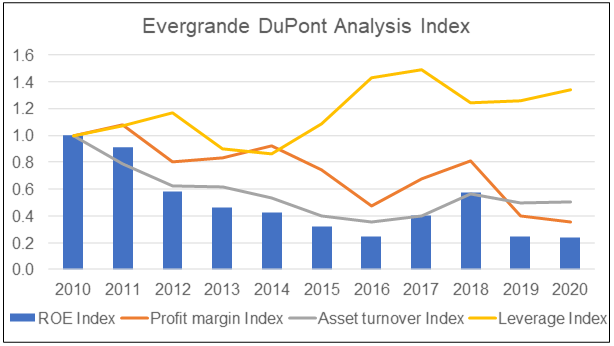
I also tracked how the various components of the ROE had changed from 2010 to 2020.
- You can see that the Profit margin and Asset turnover for Evergrande were declining from 2010 to 2020 causing the ROE to decline.
- At the same time, Evergrande was increasing its Leverage. However, the increase in the Leverage was not sufficient to offset the decline in the Profit margins and Asset Turnover.
 |
| Table 7: DuPont Analysis Trend |
Profit Margin
Here Evergrande's performance was below that of the Malaysian Large Property developers.
- From 2010 to 2020, Evergrande had an average profit margin of 13 %.
- For the same period, about 41% of the Malaysian property companies had an average profit margin that exceeded that of Evergrande. Actually, almost 3/4 of those in the Malaysian Large group had average profit margins that exceed the Evergrande average.
 |
| Chart 9: Profit Margin |
The average profit margin of the 3 groups of Malaysian property companies had been declining since 2011/12. The pattern is similar for Evergrande.
About 1/5 of the Malaysian property companies had profit margins in 2020 that were higher than their respective profit margins in 2010. Do not confuse this with those that did better than Evergrande as shown in the table. I defined “better” as having a trend that is more than (8 %). A trend of (5 %) is deemed better.
 |
| Table 8: Profit Margin parameters |
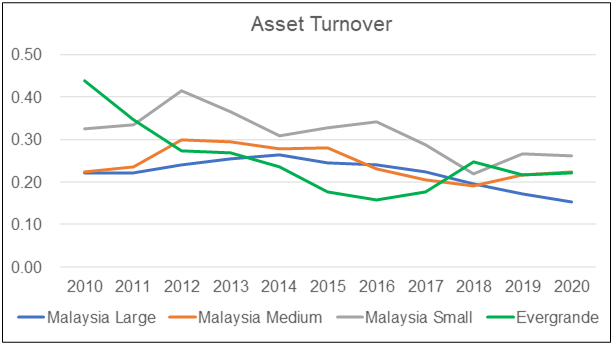
The picture is different when you looked at individual Malaysian property companies. About 1/4 of them had Asset Turnover in 2020 that were higher than their respective Asset Turnover in 2010. Do not confuse this with those that did better than Evergrande as shown in the table. I defined “better” as having a trend that is more than (7 %). A negative trend of 5 % is deemed better.
 |
| Table 9: Asset Turnover parameters |
Leverage
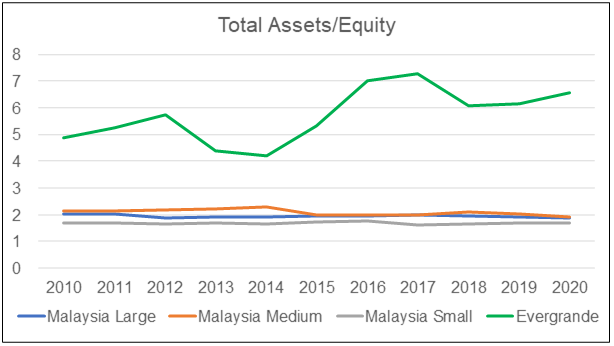
Of the 3 DuPont components, it was the Leverage that stood out when comparing Evergrande's performance with those of the 3 Malaysian groups. Evergrande Leverage was not only several times larger than the Malaysian ones, but it also grew from 2010 to 2020.
- Evergrande's average Leverage from 2010 to 2020 was 5.72.
- There was no Malaysian company with such a high Leverage. There was only one Malaysian company - Encorp - that had an average Leverage of greater than 5 for the same period.
 |
| Chart 11: Leverage |
Despite its high Leverage of 4.89 in 2010, Evergrande's Leverage grew to 6.57 by 2020. This was about 3 % growth annually.
To be fair, there were 22 Malaysian companies that had more than 3% annual growth in Leverage from 2010 to 2020. But among these 22 companies, the highest average Leverage was 4.56.
 |
| Table 10: Leverage parameters |
|
Gross profitability
Gross profitability is defined as gross profit divided by total assets.
Professor Robert Novy-Max, University of Rochester, has done considerable research into this metric. According to him, it has roughly the same power as book-to-market predicting the cross-section of average returns.
I used it as an indicator of the potential return.
 |
| Chart 12: Gross Profitability |
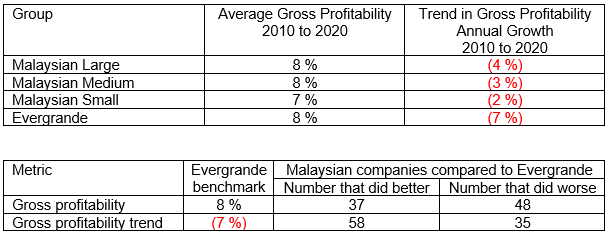
Evergrande's performance did not stand out when compared to the Malaysian groups. Furthermore, Evergrande's gross profitability had declined the most from 2010 to 2020.
There were 33 Malaysian companies whose gross profitability had grown from 2010 to 2020.
 |
| Table 11: Gross Profitability parameters |
Malaysian companies with substantial red flags
In Part 1, I identified the following metrics that can be used as red flags.
 |
| Table 12: Red flags |
When I compared the 85 companies based on these metrics, 3 companies scored 5 or more out of these 7 metrics as summarized below.
 |
| Table 13: Red flags score Notes
|
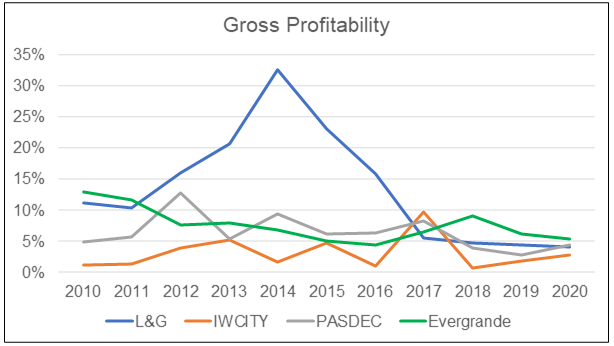
The performance of these 3 companies compared to Evergrande on a number of return metrics are shown in the following charts.
- In terms of ROE, the 3 Malaysian companies on average did worse than Evergrande.
- In terms of Gross profitability, only L&G on average did better than Evergrande. This was because it achieved good returns from 2013 to 2016 but this has since deteriorated.
 |
| Chart 13: ROE comparison |
 |
| Chart 14: Gross Profitability comparison |
In terms of the cash generation, like Evergrande, IWCIT and PASDEC did not have positive cumulated cash flow from Ops from 2010 to 2020. L&G did well in the early part of the decade and only incurred negative cash flows for the past few years.
 |
| Chart 15: Cash Flow/Revenue comparison |
I also compared the companies based on 3 academic indicators used to screen for companies with potential problems. The indicators are
- Altzman Z Score. This is an indicator by Professor Edward I. Altman, New York University. It is based on financial ratios calculated from data from the company’s Annual Report. It is used to predict whether a company has a high likelihood of bankruptcy.
- Beneish M Score. This is a statistical model by Professor Messod D. Beneish, of Indiana University. It uses a number of financial ratios calculated from accounting data. The goal is to see whether it is likely that the reported earnings of a company have been manipulated.
- Piotroski F Score. This is an indicator developed by Professor Joseph D. Piotroski of Stanford University. It has a number between 0 to 9 which is used to assess the strength of a company’s financial position.
How did the 4 companies perform on these 3 indicators? Refer to the table below.
- All 4 companies failed the Altzman Z Score.
- L&G and IWCIT did not meet the Beneish M Score while I would put PASDEC and Evergrande on the borderline.
- All of them met the Piotroski M Score threshold.
 |
| Table 14: 3 Indicators |
Notes
a) I did not compute the past 4 years average as this indicator required the current market price as one of its inputs
b) Based on average from 2017 to 2020
c) Based on average from 2017 to 2020
L&G
L&G was red-flagged because of its inventory and payables. However, the L&G situation was different from Evergrande in that the growth in Inventory Days and Payable Days was due to falling revenue.
If you look at the L&G index chart, you can see that in the early part of the decade, revenue, inventory, and payables were growing at similar paces. However, in the latter part of the decade, revenue declined while inventory and payables did not decline proportionately.
 |
| Chart 16: L&G Performance |
L&G also does not have a large debt burden as its average Debt Equity of 0.15 is very much smaller than Evergrande’s 2.00. I had also shown earlier that L&G did not have cash generation problems.
L&G challenge is more about its sales and is unlikely to be an Evergrande.
IWCITY
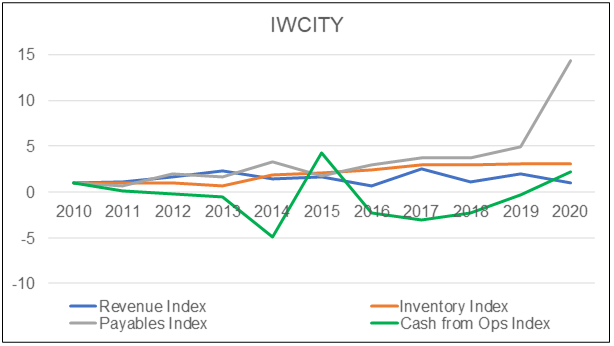
IWCIT did not experience and significant revenue growth from 2010 to 2020. But inventory and payables grew resulting in it being red-flagged for
- Average Inventory Days and average Payable Days.
- Growth rates for Inventory Days and Payables Days.
 |
| Chart 17: IWCITY Performance |
At the same time, IWCITY had negative accumulated cash flow from operations from 2010 to 2020.
But IWCITY does not have a large debt burden as its average Debt Equity of 0.25 is very much smaller than Evergrande’s 2.00. However, this had grown from 0.01 in 2010 to 0.23 by 2020.
PASDEC
PASDEC's main problem was its low sales. From 2010 to 2020, it had the following average annual performance:
There were no significant growths in inventory or payables during the past 11 years. But revenue declined by about 8 % annually. You should not be surprised that it was red-flagged for Inventory Days and Payable Days - both for the average values as well as growth.
At the same time, it did not accumulate any positive cash flow from operations from 2010 to 2020.
Its positive point was that it had an average Debt Equity ratio of 0.29.
Conclusion
Unlike Evergrande, the 3 Malaysian companies red-flagged did not have revenue growth. Their Inventory, Payables, and even Cash Flow problems can be attributed to the lack of revenue growth.
 |
| Table 15: Comparison between Evergrande and the 3 Malaysian property companies |
Secondly, Evergrande’s liquidity problem was due to its high Debt levels with an average Debt Equity of 2.00. The 3 Malaysian companies' average Debt Equity ratios are significantly less.
In Part 1, I concluded that the Malaysian property companies are resilient because none met all of Evergrande’s 7 red flags criteria.
If these 3 companies with 5 to 6 red flags are also not likely to go Evergrande’s way, it reinforces the resilient picture. This is unlike the 90s during the Asian Financial Crisis when several property companies had to be restructured.
End of Part 2 of 2
- - - - - - - - - - - - - - - - - - - - - - - - - - - - - - - - -
How to be an Authoritative Source, Share This Post
|
Disclaimer & Disclosure
I am not an investment adviser, security analyst, or stockbroker. The contents are meant for educational purposes and should not be taken as any recommendation to purchase or dispose of shares in the featured companies. Investments or strategies mentioned on this website may not be suitable for you and you should have your own independent decision regarding them.
The opinions expressed here are based on information I consider reliable but I do not warrant its completeness or accuracy and should not be relied on as such.
I may have equity interests in some of the companies featured.
This blog is reader-supported. When you buy through links in the post, the blog will earn a small commission. The payment comes from the retailer and not from you.



Comments
Post a Comment