Is LIIHEN one of the better Bursa Malaysia furniture stocks?
Value Investing Case Study 25-1. I had identified LIIHEN as a potential candidate in my Dec 2021 article on the Malaysian furniture sector. This is my investment thesis on LIIHEN.
In Dec 2021, I published a post “Which are the better stocks in Bursa Malaysia furniture sector?” on the furniture companies under Bursa Malaysia. I had identified 3 potential candidates for investments - LEESK, LIIHEN, and YOCB.
I had looked at LEESK in my 16 Jan 2022 post. In this post, I will look at LIIHEN.
LII Hen Industries Bhd (LIIHEN or the Group) had released its unaudited 2021 results that showed a decline in revenue and PAT. Management attributed:
- The declining revenue to the longer shut down period in 2021 compared to 2020 to curb the spread of Covid-19.
- The declining PAT to higher raw materials cost and longer non-productive period. This was coupled with the weaker US Dollar against Ringgit Malaysia.
Yet when Malaysia went into a lockdown in 2020, the Group revenue and PAT for FYE 2020 were not affected compared to those of 2019. What do the 2021 results mean when looking at the prospects of the Group?
Join me as I showed that LIIHEN is still an investment opportunity.
Should you go an buy the shares then? Well, read my Disclaimer.
Contents
- Summary
- Investment Thesis
- Group background
- Fundamentally sound
- Valuation
- Risks
- Conclusion
|
Summary
- LIIHEN is fundamentally a strong company. It is financially strong with a strong growth track record. Management had a good track record as an operator and capital allocator. The Group had been able to create shareholders’ value.
- A valuation of LIIHEN showed sufficient margins of safety. It is 32 % under the Optimistic EPV. It is a 65 % margin of safety under the Optimistic Earnings Value with growth.
- As such I would conclude that LIIHEN is one of the better Bursa Malaysia furniture stocks. But there are some risks. The first is whether the Group would be able to maintain its exports to the US. The second is whether the Ringgit would strengthen relative to the US Dollar.
Investment Thesis
LIIHEN had a fantastic 12 years run. Revenue had grown due to increased sales to the US. At the same time, there was a 30% jump in the Ringgit to the USD exchange rate that boosted its gross profit margins.
The Group is fundamentally strong with about 1/3 of the shareholders’ funds in cash. There is currently a margin of safety based on the Optimistic EPV. The key risks are whether it can continue to grow its exports and whether the Ringgit would strengthen.
The recently announced 2 for 1 bonus issue would also be a catalyst for a higher market price.
|
Group background
The Group is involved in the manufacture and sales of furniture products as well as rubber tree plantations. The main focus is furniture as the plantation segment is relatively small accounting for less than 1 % of the Total Assets in 2020.
The Group’s furniture activities are carried out wholly in the Muar and Tangkak districts of Johore, Malaysia. The operational sites occupy about 3 million sq. feet of built-up area. The Group manufactures a vast range of wood-based products. Examples are bedroom sets, solid dinettes, office furniture, upholstery sofa sets, and utility shelves. The Group caters mainly to the overseas market, especially North America, which constituted about 95% of the 2021 revenue.
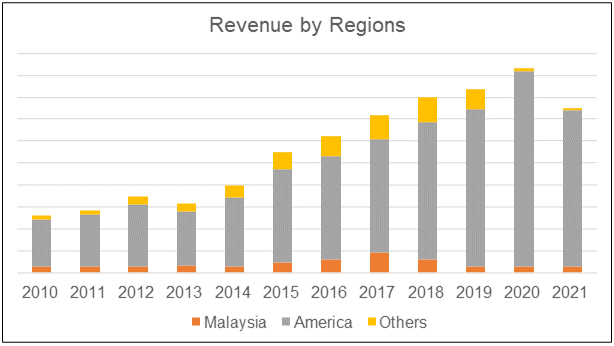 |
| Chart 1: Revenue Profile |
In 2007/08 the Group obtained the right-of-use for 3,473 hectares of permanent reserve forest estates in Johor. This was for the cultivation of rubberwood trees. This was reduced to 436 hectares in 2015. The Group commenced the plantation infrastructure and cultivation activities in 2015. Currently, there is no significant contribution from this segment.
Fundamentally sound
LIIHEN is a fundamentally sound Group based on the following:
- Strong financially.
- Strong growth track record.
- Good management track record.
- Good track record of creating shareholders’ value.
Refer to the details in the following sections.
Strong financially
The Group had a Total Capital Employed (TCE) of RM 485 million as of the end of 2021. SHF accounted for about 91 % of the TCE with the bulk of the balance from Debt.
I would rate the Group as financially strong for the following reasons.
- The Group had a Debt Equity ratio of 0.09. Historically the Group had a low Debt Equity ratio with an average of 0.14 for the period from 2010 to 2020. In contrast, the sector average Debt-Equity ratio for the same period was 0.23.
- About 1/3 of the TCE is in the form of cash and/or fixed deposits.
- The Group had been able to generate positive Cash flow from Operations yearly from 2010 to 2021. On average, the Group had a Cash flow from Operation to PAT ratio of 0.99. The sector average ratio was 1.18.
Note that the sector here refers to the 21 Bursa Malaysia furniture companies (including LIIHEN) that were covered in my Dec blog post.
 |
| Chart 2: Sources and Uses of Funds |
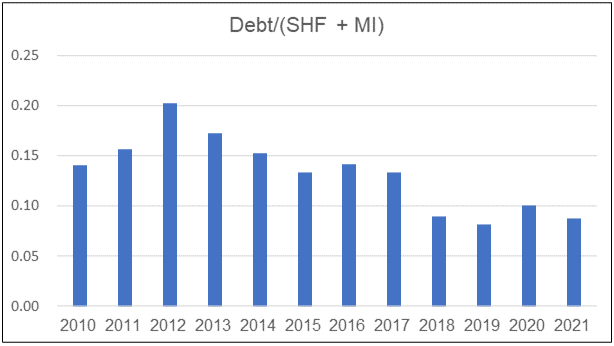 |
| Chart 3: Debt Equity Profile |
Strong growth track record
The chart below shows the revenue, PAT, and gross profitability trends for the Group over the past 12 years. You can see the impact of the Covid-19 measures on the 2021 results. Over the period from 2010 to 2021:
- Revenue grew at 10.1 % CAGR despite the hiccup in 2021.
- PAT grew at 7.9 % CAGR. The performance in the second half of the period was much better than that in the first half.
- Gross Profitability in the first half of the period averaged 26 % compared to the 31 % average in the second half of the period.
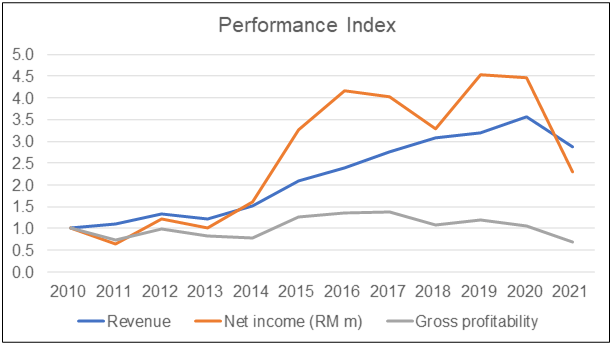 |
| Chart 4: Performance Index |
The Group had an average ROE of 18% from 2010 to 2021. The ROE peaked in 2016 and there has been a decline since then. There are 2 main reasons for the decline:
- One is the Covid-19 measures that caused the ROE in 2021 to be lower than that in 2010.
- Another was the growth in the Non-Operating Assets - cash and fixed deposits. These averaged about RM 28 million from 2010 to 2012. But it had grown to RM 160 on average from 2018 to 2021.
I also carried out a DuPont analysis of the ROE. You can see that the bulk of the changes in the ROE was due to the changes in the Profit Margins. Asset Turnover and Leverage were relatively stable.
This meant that the revenue growth was matched by the growth in Total Assets.
 |
| Chart 5: DuPont Analysis |
Good management track record
I assessed management from 2 perspectives - operations and capital allocation.
In terms of operations, I looked at 2 metrics - revenue growth and ROA. The following charts showed that LIIHEN performed well relative to the sector average.
 |
| Chart 6: Revenue Comparison |
 |
| Chart 7: ROA Comparison |
In terms of capital allocation, I looked at how the Group has used its Cash flow from Operations. During the period from 2010 to 2021, the Group generated RM 544 million Cash flow from Operations. Of these:
- RM 211 million was paid out as dividends. Considering that the Group generated about RM 525 million of PAT, this was equal to about a 38 % payout ratio.
- RM 188 million was spent on Net CAPEX.
- There was an increase of RM 131 million in cash and fixed deposits.
I would consider this a good capital allocation plan. The only negative here was that there is too much cash held back. These should be given back to the shareholders if management does not have good investment plans.
 |
| Chart 8: Deployment of Cash Flow from Operations |
Good track record of creating shareholders’ value
I judge shareholders’ value creation based on 3 metrics:
- Comparing returns with the WACC.
- Comparing the gain in SHF assuming no dividend was paid with the cost of equity.
- Comparing the gains by an investor who bought a share at the end of 2010 with the cost of equity.
As can be seen from the table below, LIIHEN returns were higher than the respective cost of funds. I would conclude that the Group had been able to create shareholders’ value.
 |
| Table 2: Shareholders' Gain |
Valuation
My valuation was based on a single-stage model with the following.
EBIT = Gross Profit - SGA
Free cash flow to the firm FCFF = EBIT(1-t) X (1 - Reinvestment rate)
Value = FCFF X (1+g) / (r-g)
Where:
r = WACC
g = growth rate
Reinvestment rate = growth rate/return
I considered 3 scenarios:
- A Conservative EPV Scenario where the revenue is based on the past 12 years average.
- An Optimistic EPV Scenario where the revenue is based on the past 5 years’ average.
- An Optimistic Earnings with growth Scenario where the revenue is based on the past 5 years average. I then assumed a 4 % annual growth rate based on the GDP.
The other assumptions are shown below. I took the 2010 to 2021 average values for the Gross Profit margins and SGA margins. This was because they were more conservative values compared to the past 5 years average.
 |
| Table 3: Valuation Assumptions Notes (a) This value is different from that shown in Table 1 because the EBIT was derived based on the valuation model. The TCE was the 2021 value. (b) Refer to the “LEESK one of the better Bursa furniture stocks to invest in?” if you want to see a chart of the long-term Malaysian GDP growth |
The results of the valuation are summarized in Table 4. The main reason for the difference in the EPV under both scenarios is the revenue assumption.
 |
| Table 4: Valuation Metrics |
Based on the above assumptions, with the market price at RM 3.00 per share (as of 28 Feb 2022), there are margins of safety.
- It is a 32 % margin of safety under the Optimistic EPV.
- It is a 65 % margin of safety under the Optimistic Earnings Value with growth (EV with g)
As can be seen, the margin of safety is based on your revenue outlook. I think that the revenue based on the past 12 years is very conservative as revenue has grown over the past 12 years. I am more confident that the past 5 years’ average revenue reflects the picture going forward.
 |
| Chart 9: Valuation |
Risks
According to Professor Greenwald, you can get strategic insights by comparing the Asset Value (AV) with the EPV.
In a freely competitive environment, you would expect the AV to be equal to the EPV. If you have a situation where the AV > EPV, it must mean then there are under-utilized assets.
If you have a case like that of LIIHEN where the AV < EPV, it can only be sustainable if the company has some competitive advantage.
Michael Porter defined two ways in which an organization can achieve a competitive advantage over its rivals. They were cost advantage and differentiation advantage.
- Cost advantage is when a business provides the same products and services as its competitors, but at a lesser cost.
- Differentiation advantage is when a business provides better products and services than its competitors.
LIIHEN is an OEM-type manufacturer as its products are sold to importers, wholesalers, and retailers. Branding does not seem to be a major focus of the Group. As such its competitive advantage is likely based on cost.
The question then is whether this cost advantage is due to operating efficiencies or some external factors.
The chart below shows the key operating trends for the Group.
- There is a jump in the gross profit margins in 2015/2016 and thereafter there has been some decline.
- The other “fixed cost” items such as SGA margin and Depreciation (DA) margin do not seem to show much improvement. This was despite the revenue in 2020/21 being more than 3 times that of 2010. I had expected a reduction in these margins given the sizeable increase in sales.
- Asset Turnover was also “stable”. This meant that revenue growth was driven by assets growth.
 |
| Chart 10: Operating Performance |
The general picture is that the improvements in the gross profit margins were not driven by operating efficiencies. You should not be surprised by this as the Group had faced many cost issues over the years. The following from the various Annual Reports illustrate this,
- 2020 Annual Report - The cost increase was higher than the increase in sales volume, largely due to upward price adjustment of raw materials…The surge in labour cost was mainly due to an increase in headcount and an increase in minimum wages by RM50 per head…
- 2018 Annual Report - This increase (in raw materials cost) was in line with the increase in sales volume and escalation of certain raw materials costs such as board/wood and packing materials. The direct labour and subcontractors’ charges continued to rise…
- 2016 Annual Report - the cost of sales was negatively impacted by the increase in labour cost…as compared to last year due to the acute shortage of manpower.
If the increase in the gross profit margin is not due to improvements in the operating efficiencies, is there another reason? One possible reason is the forex. The majority of the Group products are exported. Forex has an important impact here, especially if the bulk of the cost of sale is in local currencies.
The chart below shows the USD to RM exchange rate for the past 12 years. You can see a jump in 2015/16 that coincides with the jump in gross profit margins.
 |
| Chart 11: RM to USD. Source: FRED |
I wanted to see what happens if there was no change in the exchange rate. I did a simple analysis based on the following scenario.
- Only revenue was affected by forex. To “cleanup ” the forex effect, I adjusted the revenue for each year by a forex factor. The forex factor for the year = exchange rate for 2010/exchange rate for the year.
- The cost of sales is assumed to be all in Ringgit.
- I then derived the “cleanup” gross profit by deducting the cost of sales from the “cleanup ” revenue.
- I then computed the "cleanup" gross profit margin.
The results are shown in the table below. You can see that there is a significant reduction in the gross profit margin from 2015.
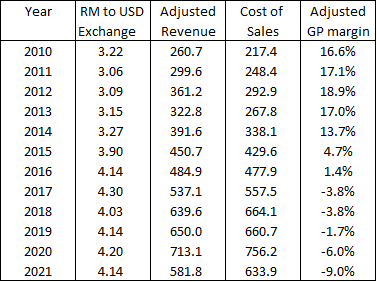 |
| Table 5: Impact of Forex on GP Margin |
While this is a back-of-envelope analysis, it does show that the change in the forex has a big impact on the gross profit margins.
There are two related concerns here:
- Will the US furniture sector continue to grow? This is because America accounted for a large part of the revenue.
- Will the Ringgit strengthen and reduce the gross profit margins?
According to its 2020 Annual Report,
“… higher revenue was largely driven by a revival in the residential construction market which boosted demand for furniture; increased online purchase, particularly for the home-office furniture as more people were working from home and the diversion of orders from China to Malaysia due to the U.S-China trade war where U.S importers faced higher import duties for furniture imported from China.”
In my Optimistic valuation scenario, I had assumed that the revenue was based on the past 5 years’ average. I would like to think that this risk is manageable in the sense that I expect the US economy to continue to grow. At the same time, LIIHEN could build up its exports to other countries.
The analysis in Table 5 shows that forex is critical. I am not good at forecasting macro-economic changes. Would the 32 % to 65 % margin of safety provide some leeway here?
I did a sensitivity analysis for the Optimistic scenario where I assumed that the cost of sales and SGA remained unchanged. Thus, any change in Revenue due to changes in the forex would only impact the Revenue and not the cost components.
I wanted to find out the amount the Ringgit has to strengthen for the intrinsic value of LIIHEN to be equal to RM 3.00 per share. The answer was very shocking. It was a 3 % strengthening of the Ringgit for both the Optimistic EPV and EV with g scenarios.
This of course assumed that there was no reduction in the cost of sales or SGA when the Ringgit strengthened. But it does show how sensitive the margin of safety is to the forex changes.
|
Conclusion
LIIHEN is fundamentally a strong company.
- It is financially strong.
- It had a strong growth track record, in terms of top-line, bottom-line as well as gross profitability.
- Management had a good track record as an operator and capital allocator.
- It had been able to create shareholders’ value.
A valuation of LIIHEN showed sufficient margins of safety.
- It is 32 % under the Optimistic EPV.
- It is a 65 % margin of safety under the Optimistic Earnings Value with growth.
As such I would conclude that LIIHEN is one of the better Bursa Malaysia furniture stocks.
But there are some risks. The first is whether the Group would be able to maintain its exports to the US. The second is whether the Ringgit would strengthen relative to the US Dollar.
In Jan 2022, the Group had announced a 2 for 1 bonus issue that will probably be completed in the second quarter of 2022. I see this as a catalyst for a higher market price.
End
- - - - - - - - - - - - - - - - - - - - - - - - - - - - - - - - -
How to be an Authoritative Source, Share This Post
|
Disclaimer & Disclosure
I am not an investment adviser, security analyst, or stockbroker. The contents are meant for educational purposes and should not be taken as any recommendation to purchase or dispose of shares in the featured companies. Investments or strategies mentioned on this website may not be suitable for you and you should have your own independent decision regarding them.
The opinions expressed here are based on information I consider reliable but I do not warrant its completeness or accuracy and should not be relied on as such.
I may have equity interests in some of the companies featured.
This blog is reader-supported. When you buy through links in the post, the blog will earn a small commission. The payment comes from the retailer and not from you.


Comments
Post a Comment