How to overcome issues when valuing cyclical companies
Fundamentals 24: This article looks at the issues and practical solutions when analyzing and valuing cyclical companies. They are based on the author’s own experience.
I am a long-term value investor with an average holding period of 6 to 8 years. I look for companies that are trading cheaply relative to their intrinsic values. I then hold onto them until they get overpriced before selling to re-invest in other undervalued companies.
If I am lucky, the companies I sold become cheap after some time allowing me to re-invest in them.
That is why I like cyclical companies. It is relatively easier to project their future performances. Secondly, their prices are cyclical giving you opportunities to make money from them several times.
Join me as I share the practical problems when analyzing and valuing such companies. I use the following steps when analyzing and valuing cyclical companies:
- Identify the macro-economic variable that changes in a cyclical manner.
- If necessary, use correlation to verify that the company is a cyclical one.
- Determine the performance over the cycle.
- Estimate the cyclical value.
I will illustrate them with examples of companies I have invested in such as those in the steel and property sectors.
Should you go and buy such companies? Well, read my Disclaimer.
Content
- Cyclical companies
- Identifying the cycle
- Valuation of cyclical companies
- Normalization
- Special situations
- Conclusion
|
I focus on cyclical companies for 2 main reasons:
- Easier to project performance.
- Opportunities for repeatedly buying and selling.
As a value investor, the key is identifying undervalued companies. This requires you to determine the intrinsic values so that you can compare them with the market prices.
All valuations are based on assumptions about the future. With cyclical companies, I am confident that the historical cyclical patterns can provide good clues about the future.
You should not be surprised as the fundamentals driving the performance are cyclical. These are easier than projecting the performances of non-cyclical ones.
Secondly, the market prices of cyclical companies are also cyclical. Chart 1 shows the market prices of some Malaysian cyclical companies. You can see several peaks and troughs over the past 10 years giving you several opportunities to sell and buy.
 |
| Chart 1: Price Trends of some Bursa Malaysia Companies |
I already spent time analyzing and valuing such companies when I first invested in them. So, when there are opportunities to re-invest in them, they are no-brainer decisions.
Cyclical companies
According to Investopedia,
"...a cyclical stock is one whose price is affected by macroeconomic or systematic changes in the overall economy. Cyclical stocks are known for following the cycles of an economy through expansion, peak, recession, and recovery."
"...a commodity is a basic good used in commerce that is interchangeable with other goods of the same type. Commodities are most often used as inputs in the production of other goods or services."
A commodity company is thus one that produces, refines, or distributes the materials used in other businesses.
"The key characteristic...commodity companies... are thus dependent upon the price of the commodity for their earnings and value..." Damodaran.
Such companies are considered cyclical as commodity prices are cyclical. There are price cycles due to the repeated mismatch between supply and demand. Supply could be excessive or short due to weather conditions. Demand could be driven be other factors such as interest rates and other economic forces.
"Commodity prices have undergone repeated cycles over the past fifty years. On average, the cycles lasted almost six years, peak to peak." World Bank.
So there are 2 categories of cyclical stocks:
- Those whose performance is tied to movements in the general economy. Examples are property companies and banks.
- Commodity companies whose cycles may be different from the general economic cycles. Examples are steel and plantation companies.
Damodaran groups cyclical and commodity companies together when it comes to valuation. According to him:
"Cyclical and commodity companies share a common feature, insofar as their value is often more dependent on the movement of a macro variable (the commodity price or the growth in the underlying economy) than it is on firm specific characteristics...Since both commodity prices and economies move in cycles, the biggest problem we face in valuing companies tied to either is that the earnings and cash flows reported in the most recent year are a function of where we are in the cycle, and extrapolating those numbers into the future can result in serious misvaluations."
There are usually macroeconomic or commodity parameters that change in a cyclical manner over time. The first step is to verify that a particular company is cyclical. Sometimes this may require a correlation analysis between the company's revenue and the macroeconomic or commodity variable.
If the correlation is less than 70%, I would ignore the cyclical analysis. This correlation number meant that the macro variable explained less than half of the revenue changes. This is even though the company may be thought of as being in a cyclical sector.
Sometimes through correlation analysis, I identified cyclical companies. This is even though they are not commodity companies or in sectors normally considered cyclical.
For example, I identified Tempur-Sealy, a US bedding group, as a cyclical one. This is because of the strong correlation between its revenue and the US Housing Starts as shown in Table 1.
 |
| Table 1: Correlation between Tempur Sealy revenue and Housing Starts |
Identifying the cycle
To determine the company’s performance over the cycle, you must be able to identify the peak and trough of the cycle.
This is not as straightforward as it seems.
- The first is determining what metrics to use to track the cyclical pattern.
- The second is that sometimes pinpointing the peak or trough is not so straightforward.
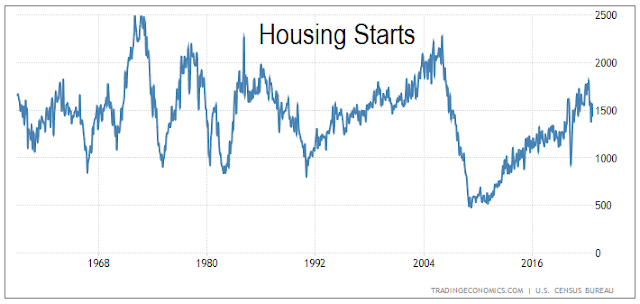
For example, the US home building sector is cyclical and one way to identify this is to look at the US Housing Starts. As you can see from Chart 2, there are cycles. But when is the peak for the 1970 period?
 |
| Chart 2: US Housing Starts. Source: TradingEconomics.com |
I also carried out an analysis for the Malaysian property sector. Refer to "How to identify property cycles for equity investment opportunities". I suggested using the Housing Price Index to identify the Malaysian property cycle. I found this to be better than Residential Starts or Residential transactions.
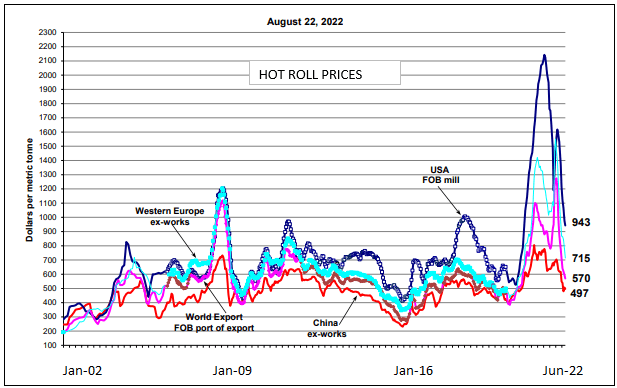
When it comes to steel, I use steel prices as illustrated in Chart 3. As can be seen, there are common price movements across the regions. But if you are analyzing US steel companies, you should focus on US steel prices.
 |
| Chart 3: Global Steel Price Source: SteelBenchmarker |
It is sometimes not easy to find indicators that show a cyclical pattern. For example, it is commonly accepted that the construction sector is cyclical. But finding indicators that will enable you to identify the peak and trough is not so straightforward.
For example, Chart 4 shows the US Construction Spending. Looking at this, would you conclude that the sector has peaked? Yet I found the following comments on the current US construction sector:
“…the US construction sector continues to shrink”. Jan 2023 FX Street
“The construction industry in the US is expected to contract by 7% in 2022, following a 1.0% increase in 2021”. Dec 2022 GlobalData
 |
| Chart 4: US Total Construction Spending Source: FRED |
If you cannot identify the macroeconomic or commodity factors, how can you do the correlation analysis?
If you are trying to normalize performance, how can you do this if the peaks or troughs are not obvious?
In practice, I just choose the most readily available indicator. For the peak and trough, I use the ones easily eyeballed. I then rely on the margin of safety to take care of the uncertainties.
|
Valuation of cyclical companies
To overcome the recent year’s "distortion" problem, Damodaran suggests that we use "normalized" values.
He suggested 3 ways to handle this:
- Use the average values over the cycle.
- Use the current revenue but with margins normalized over the cycle.
- Use the normalized sector values for companies without sufficient cycle history.
There is a challenge with the first approach. If the company has grown since the start of the cycle, the average cyclical values will not capture its current size.
That is why I prefer the second approach. I avoid the last approach if I can as I would miss the company-specific characteristics that are critical to the investment thesis.
The key point when valuing a company over the cycle is that you have to be consistent. In other words, the following should also be cyclical:
- Free cash flow or the various parameters used to derive the Free cash flow.
- Discount rate.
- Growth rate. If you are using the fundamental growth rate, then the Return and Reinvestment rate should also be cyclical values.
It is obvious that for a representative value over the cycle, the ideal is to cover at least one cycle. This can be the average peak-to-peak values or trough-to-trough values.
For example, in my valuation of BlueLinx, I used the 2005 to 2022 average as this coincided with the peak-to-peak of the US Housing Starts. Refer to “BlueLinx: The Market Is Not Pricing This As A Cyclical Company”
But in my valuation of Tempur-Sealy, there was not enough historical data. This was because there were 2 major acquisitions during the 2005 to 2022 Housing Starts cycle. The company in 2022 was different from that in 2005. I then used the post-acquisition year 2014 as the starting point. My cyclical averages were then based on the 2014 to 2022 period.
Focus on Asset value and EPV
Cyclical companies tend to be those in the mature stage of the life cycles with a growth rate at best the same as the GDP growth rate. As such I do not have to worry about modeling the cyclical ones with multi-stage growth models.
Rather the focus is on Asset-based valuation and EPV. Where growth is accounted for, I use the single-stage model. The key to valuing such companies is succinctly summarized by Bruce Greenwald:
"In commodity businesses...You want to put a value on what you’re buying that’s better than you can do with one of these speculative DCF calculations based on unreliable projections of future prices. That’s basically doing an asset value, doing a current earnings power value, and triangulating between the two..." Bruce Greenwald on the future of value-oriented investing
Normalization
I use the single-stage discounted Free cash flow to the Firm (FCFF) model to value cyclical companies. The intrinsic value of the operating assets = FCFF × (1+g) / (WACC-g).
Total value of the firm = value of operating assets + value of non-operating assets.
Value of equity = Total value of the firm - Debt.
Where the terms are normalized values of the following:
FCFF = EBIT× (1-t) x (1-Re).
EBIT = earnings before interest and taxes.
t = tax rate.
g = fundamental growth rate = Return x Reinvestment rate.
WACC = weighted average cost of capital.
Return = EBIT(1-t)/TCE
TCE = Total Capital Employed = Shareholders funds + Minority Interests + Debt - Non-operating assets.
Re = Reinvestment rate = Reinvestment/EBIT(1-t).
Reinvestment = CAPEX - Depreciation & Amortization + Increases in Net Working capital.
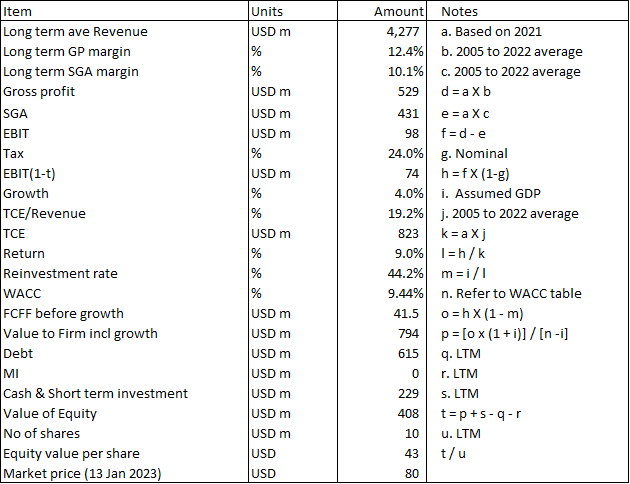
A sample template used in my calculation is shown in Table 2.
 |
| Table 2: Estimating the intrinsic value of cyclical companies |
EBIT
I generally determined the normalized EBIT from the equation:
EBIT = Revenue x (Gross profit margin - SGA margin).
Revenue = Normalized revenue taking into account the current situation.
The Gross profit and SGA margins are the average values over the cycle.
The starting point is then the revenue. For non-commodity cyclical companies, I use the current revenue as the normalized one. But for commodity companies, the revenue is the one with the average commodity price or quantity.
One example is my US home builders’ analyses. I took the normalized revenue as the revenue for the year when the Housing Starts is at the long-term average annual Housing Starts.
Another example is my Steel Dynamics analysis. I took the normalized revenue = normalized quantity × normalized steel price. The normalized quantity is based on the company’s capacity. The normalized price is based on the average price over the cycle.
Note that I did not explicitly adjust for inflation as I assumed that the historical prices have done this.
As for the Gross profit and SGA margins, I took the average margins over the last cycle.
Tax rate
Damodaran suggests that we use the nominal tax rate as the normalized one.
The challenge here is when a company has international operations with different tax regimes. In such cases, I take the average tax rates over the cycle adjusted for one-off items.
Growth, Return, and Reinvestment rate.
Cyclical companies tend to be companies in the mature stage of their life cycle. As such, the growth rate I used is the lower of the long-term GDP growth or actual average revenue growth rate over the cycle.
Once I set the growth rate, I use the fundamental growth equation to determine the normalized Reinvestment rate. Note that I require this Reinvestment rate to determine the FCFF.
For the EPV case where there is no growth, I set the Reinvestment rate = 0.
But for the non-zero growth rate, I start with the Return = EBIT(1-t)/TCE.
To get the normalized TCE, I determined the average TCE/Revenue ratio over the cycle. I use this ratio together with the normalized Revenue to derive the normalized TCE.
To get the normalized Reinvestment rate, I then use the equation:
Reinvestment rate = g/Return.
WACC
There are 4 key parameters in determining the WACC - the risk-free rate, risk premium, Beta, and Debt Equity ratio.
You will need them to first determine the cost of equity and the cost of debt. The Debt Equity ratio will then give you the weights to determine the WACC. The values for each of them have to be the value over the cycle.
Chart 5 below illustrates how these have changed from 2005 to 2022 for the US Housing Starts cycle. So, if you do not use the values of the cycle, it will not reflect the actual situation.
In practice, I use the current rate and rely on the margin of safety.
It is not exactly the best approach, but it is a practical one. There are other issues when estimating the WACC that makes the determining the cyclical values more challenging. For example, what do you use as the normalized DE ratio over the cycle?
 |
| Chart 5: US Risk Premia trends Source: Market Risk Premia |
Special situations
Valuing cyclical companies is more than merely determining the cycle values. Business changes over time and we can have the following situations:
- Operating improvements over the cycle.
- Impairments of under-utilized assets during a prolonged downtrend.
- Excess operating assets currently relative to the normalized ones.
- Extraordinary immediate results.
- Organic growth.
As such, you should adjust the value obtained from the discounted FCFF model if you face the above. However, you have to be careful not to double-count the impact of special situations.
Operating improvements
Companies may achieve some improvements in their operations over the cycle. The Gross profit margin may have improved due to changes in the product mix. SGA margins may be reduced due to more online sales.
Technically the average values over the cycle would have accounted for some of the improvements. The challenge is when you see some trends as shown in Chart 6 for BlueLinx.
 |
| Chart 6: Gross Profit Margin with Best-Fit Line |
For such situations, the average over the cycle is just the middle cycle period value based on the trendline. There are also limits to margin improvements. So where on the trendline would you take to represent the future cyclical average? This is where detailed company analysis may provide better clues than just simple projections.
In my Builders FirstSource valuation, I found that there were margin improvements over the cycle. I then scaled the normalized margins. The scaling factor was the current peak values / previous peak values.
Non-operating assets
The cyclical operating assets are funded by TCE. I have shown how I estimated the normalized operating TCE based on the TCE/Revenue ratio.
The current TCE may exceed the normalized one. In such a situation I would consider the excess as non-operating assets. This should then be added to the total value of the firm. If there is a shortage, I would reduce the total value by this amount.
For example, in my BlueLinx valuation, the normalized TCE was USD 823 million compared to the current TCE of USD 944 million. There is thus USD 121 million of “excess TCE” that can be apportioned to Equity and Debt. This can be considered as an additional margin of safety.
Impairments
If the downtrend is prolonged, there may be an impairment of assets. As such I would consider the impairments incurred over the past cycle as part of the cyclical cost.
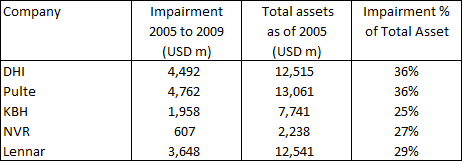
One way to account for this is to look at the total impairments as a % of the total assets. Then I used the same ratio together with the current total assets to derive the potential impairment.
This is of course assuming that the duration of the future cycle is similar to the historical one. You may have to adjust the amount to cater to a different trough and duration.
An example of this is my valuation of the US home builder “Meritage Homes: Look At Its Performance Over The Cycle”. As a homebuilder, a significant portion of Meritage’s assets is real estate. This meant that the Asset Value is a good estimate of its intrinsic value. But many homebuilders had sizeable write-downs during the last downtrend as illustrated in Table 3. As such, I provided a potential write-down in my Asset Value of Meritage.
 |
| Table 3: Asset Impairments of some US Home Builders |
Finite resources
With commodity companies, there is a finite quantity of natural resources on the planet. When valuing commodity companies, the practice of assuming perpetual growth will mean overvaluation.
This is equivalent to ignoring the declining stage when modeling mature companies. The best way to handle this is through the margin of safety.
Extraordinary immediate results
In our analysis, we are assuming that the performance over the cycle reflects the long term performance of the company. It does not consider the immediate situation which could be extraordinary.
As such I consider the value of such immediate but extraordinary performance as an extra margin of safety.
For example, steel companies had a relatively strong EPS in 2022 as steel prices had shot up extraordinarily. In “Stelco Holdings: Grossly Underpriced Cyclical Growth Company”, I considered the current EPS as an extra margin of safety.
Damodaran refers to this as an adaptive growth valuation.
"One compromise solution is to assume normalization in the long term, but to allow earnings to follow the current cycle for the short term, and to use the growth rate as a mechanism to bring us back to normalcy."
Organic growth
Cyclical companies are mature companies with stable growth. The growth rate here is usually at best the long-term GDP growth rate.
This is a growth rate driven by economic conditions - what Greenwald refers to as "organic growth". Greenwald suggests that this is "free growth" as there is not much Reinvestment required.
Examples of “free growth” are margin improvements by being more efficient. Another example is changing the product mix in favour of higher-margin products.
If you follow this view, then the Reinvestment rate from g/Return is probably on the high side. A better estimate may be in between this rate and one with maintenance CAPEX.
My point is that there is some in-built margin of safety when deriving the Reinvestment rate from the fundamental growth equation.
Conclusion
Cyclical companies’ performances are tied to some macroeconomic variable or commodity prices. The cyclical performances make it easier to project future performances compared to non-cyclical ones.
Having said that, we have to balance between:
- Normalizing performance to ensure that we are not projecting the future based on what is happening currently. This is because the current performance will be affected by where they are in the cycle.
- Adjusting performances to account for improvements and changes since the start of the cycle.
I hope I have shown you how to do them.
END
- - - - - - - - - - - - - - - - - - - - - - - - - - - - - - - - - -
- - - - - - - - - - - - - - - - - - - - - - - - - - - - - - - - - -
How to be an Authoritative Source, Share This Post
If the above article was useful, you can find more insights on how to make money in my e-book. The e-book is now available from Amazon, Kobo and Google Play.
PS: If you are in Malaysia or Singapore, the e-book can only be download from Kobo and Google Play.
How to be an Authoritative Source, Share This Post
|
Disclaimer & DisclosureI am not an investment adviser, security analyst, or stockbroker. The contents are meant for educational purposes and should not be taken as any recommendation to purchase or dispose of shares in the featured companies. Investments or strategies mentioned on this website may not be suitable for you and you should have your own independent decision regarding them.
The opinions expressed here are based on information I consider reliable but I do not warrant its completeness or accuracy and should not be relied on as such.
I may have equity interests in some of the companies featured.
This blog is reader-supported. When you buy through links in the post, the blog will earn a small commission. The payment comes from the retailer and not from you.
Disclaimer & Disclosure
I am not an investment adviser, security analyst, or stockbroker. The contents are meant for educational purposes and should not be taken as any recommendation to purchase or dispose of shares in the featured companies. Investments or strategies mentioned on this website may not be suitable for you and you should have your own independent decision regarding them.
The opinions expressed here are based on information I consider reliable but I do not warrant its completeness or accuracy and should not be relied on as such.
I may have equity interests in some of the companies featured.
This blog is reader-supported. When you buy through links in the post, the blog will earn a small commission. The payment comes from the retailer and not from you.


Comments
Post a Comment