A tough 12 years for Bursa Malaysia steel companies
Case Notes 14. This article tracked the 2009 to 2020 performance of the companies under the Bursa Malaysia iron and steel sector. It provides a picture of the steel industry in Malaysia. The data are meant to serve as base rates when analyzing steel companies. Revision date: 18 Jun 2023
In May 2021, the Malaysian New Straits Times reported that the Malaysian steel industry is expected to pick up again in 2021 after a slowdown in 2020. This was in line with rising global steel prices and the rollout of mega projects by the government. Steel prices were reportedly spiking from Asia to North America. Iron ore prices were marching higher as bets on a global economic recovery fuel frenzied demand.
I carried an update to see how the steel industry in Malaysia performed till 2022. The video provides an overview of the updated performance. Have a look if you are interested to hunt for a steel company in Malaysia to invest in.
As an investor, you may think that this augurs well for the iron and steel companies. However, steel is a commodity with cyclical prices.
According to Professor Damodaran, cyclical and commodity companies share a common feature. Their values are often more dependent on the movement of a macro variable - commodity price - than on the firms' specific characteristics.
Thus, the value of a steel company is linked to the price of steel. You have to be careful when valuing steel companies. The earnings reported in the most recent year are a function of where they are in the cycle. Extrapolating those numbers into the future can result in wrong valuations.
One way around this is to “normalize” the earnings and cash flows over the cycle. This requires you to have an understanding of the performance over the cycle.
How did the Malaysian iron and steel sector perform over the price cycle? To answer this, I tracked the performance of the iron and steel companies under Bursa Malaysia. I selected 21 companies to represent the steel industry in Malaysia, and I tracked how they performed over the past 12 years. The key results can also be used to hunt for a steel company in Malaysia to invest in:
- There appeared to be 2 steel price cycles over the past 12 years.
- The sector average revenue did not show any growth from 2009 to 2020.
- Over the past 12 years, the sector was only profitable for 5 years (as represented by the sector average PAT). The total average accumulated PAT from 2009 to 2020 can be considered as breakeven.
 |
| Chart 1: Bursa Malaysia Iron & Steel Sector Performance |
- Not surprisingly, the steel industry in Malaysia had about an average of zero returns (both ROE and ROA) from 2009 to 2020. For the same period, the US steel sector had an average ROE of 3 %.
- A DuPont analysis of the ROE for the Malaysian sector showed that the variation in profit margins accounted for most of the ROE variation.
- The steel industry in Malaysia was also very conservative when it came to debt. The sector average Net Debt to (SHF + MI) is 0.46.
Contents
- Steel industry in Malaysia
- Sector Performance
- Valuation
- Methodology
- Appendix 1
|
Steel industry in Malaysia
According to the Malaysian Ministry of International Trade and Industry (MITI), the steel industry in Malaysia can be classified into 2 product groups:
- Flat products such as hot-rolled coils, cold-rolled coils, pipes, tubes, and coated coils. These products are used as intermediate raw materials for downstream applications.
- Long products such as billets, steel bars, wire products, angles, and sections. These are used in the construction and civil engineering industry.
The iron and steel industry has a critical role to play in the economy of an industrialized country.
“The iron and steel industry is a basis for the development of a number of industries in the global economy... has the potential to contribute to the competitiveness of national producers and to the growth of the national economy.” Deloitte
This picture is no different in Malaysia exemplified by the report by MITI a few years ago.
“The Malaysian iron and steel industry contributed 2.9% to GDP in 2016... has the potential to generate up to 6.5% of GDP growth and offer up to 225,000 job opportunities in 2020.” MITI
Unfortunately, the steel industry in Malaysia is a tough one from a business perspective.
- The Malaysian Iron and Steel Federation (MISIF) projected the apparent steel consumption to grow at a CAGR of 3.5 % from 2017 to 2025. This 3.5 % CAGR is much lower than the GDP growth rate of the country. (Source: MISIF's Industry Status and Outlook Report 2018/2019).
 |
| Chart 2: Malaysia Apparent Steel Consumption. Source: MISIF |
- “Apparent steel consumption in Malaysia reached 9.5 million tonnes in 2019, down 3.2% on year, mainly due to the slowdown in the construction sector growth, Vincent Choong, national committee secretary of Malaysian Iron & Steel Industry Federation shared at the 2020 SEAISI e-Conference on July 2.” MySteel.
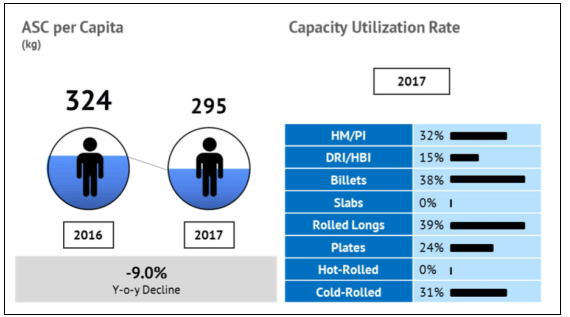
- The sector has been characterized by low capacity utilization as the following report from MISFI illustrates.
MISIF had identified several factors for this poor performance as summarized in the chart below.
 |
| Chart 4: Malaysia's Steel Industry Challenges Source: MISIF |
But it is not all doom and gloom. According to Trading Economics, Malaysia's exports of iron and steel were US$5.16 Billion in 2020. As can be seen from the chart below this has grown substantially over the past decade.
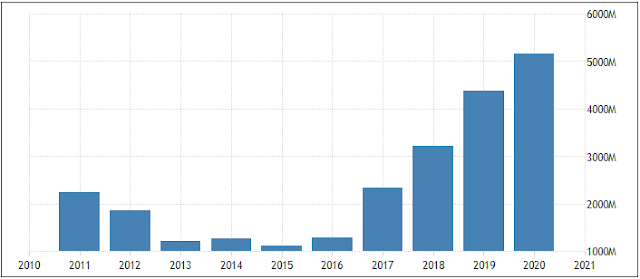 |
| Chart 5: Malaysia's Iron & Steel Exports Source: Trading Economics |
Cyclical prices
The iron/steel sector is a commoditized cyclical one. Prices are not only cyclical but the prices in different regions move in tandem as illustrated below.
 |
| Chart 6: Global Steel Prices Source: Steel Benchmarker |
Over the past 12 years, there appear to be at least 2 price cycles as shown below. Steel prices over the first 9 months of 2021 appear to be in the uptrend part of the current price cycle.
 |
| Chart 7: Steel Price Index |
Sector Performance
To see how the steel industry in Malaysia had performed, I tracked the past 12 years’ performance of the iron and steel companies under Bursa Malaysia companies.
I identified 25 companies as of Sep 2021. However, only 21 had the financial information from 2009 to 2020 to enable the tracking of the performance from 2009 to 2020.
- Refer to Appendix 1 for how I selected the panel companies.
- Refer to the Methodology section for details on how I computed the average, median, lower quartile (Q1), and upper quartile (Q3) values.
- Note that in my charts, the values are in RM million.
The profiles of these 21 companies are:
Revenue
The average revenue for the steel industry in Malaysia exhibited the cyclical nature of the iron and steel industry as shown below.
While there were ups and downs, the average sector revenue in 2020 was slightly below that in 2009. If you ignore 2020 due to the Covid-19 pandemic, the sector revenue from 2009 to 2019 grew at only 1.8 % CAGR. Contrast this with Malaysia’s GDP which grew at a 5.0 % CAGR from 2009 to 2019.
 |
| Chart 10: Sector Revenue |
In a commodity sector, there is a link between the performance of the sector and the commodity prices. The chart below illustrated such a link for the Malaysian steel companies. BTW, look for a similar link when you are hunting for a steel company in Malaysia to invest in.
 |
| Chart 11: Sector Revenue Index c/w Steel Price Index |
PAT
The net income for the steel industry in Malaysia was very volatile as illustrated by the chart below.
- Over the past 12 years, the sector was only profitable for 5 years (as represented by the sector average PAT).
- Cumulatively, the total average PAT from 2009 to 2020 can be considered as breakeven.
 |
| Chart 12: Sector PAT |
Looking at the PAT of individual companies, most of the time the companies below the first quartile were operating at a loss. In other words, about 1 / 4 of the panel was not profitable most of the time.
- For the past 12 years, only 14 (or 2/3) of the panel had positive accumulated profits. Even if you ignore the 2020 pandemic year, from 2009 to 2019, only 15 companies had positive accumulated profits.
- There were only 8 companies that were profitable annually for more than 10 years out of the 12 years.
 |
| Chart 13: Sector PAT Histogram |
Given the PAT volatility, you should not be surprised by the volatility of the Profit margin as shown below. If nothing else it showed that this was a tough industry to make money. Keep this in mind when you are looking for a steel company in Malaysia to invest in.
 |
| Chart 14: Sector PAT Margin |
I have earlier illustrated the impact of steel prices on the sector revenue. The chart below illustrated the link between steel prices and the PAT of the steel industry in Malaysia.
In practice, the profits of a steel company in Malaysia will depend on several factors. These could be its breakeven levels, the stocks it had when prices changes, and its ability to obtain supplies when the price rises. But the charts do show that profits are influenced by price changes.
 |
| Chart 15: Sector Profit Index vs Steel Price Index |
Returns
I looked at two return metrics - ROA and ROE. You should not be surprised to learn that the steel industry in Malaysia had averages of zero returns for both metrics from 2009 to 2020.
The 2 charts below show the annual returns from 2009 to 2020. The profile of the returns followed the profile of the PAT.
 |
| Chart 16: Sector ROE |
 |
| Chart 17: Sector ROA |
I also carried out a DuPont analysis of the ROE. The Dupont analysis is an expanded ROE formula calculated as follows:
ROE = PAT / Equity
= (PAT / Revenue) X (Revenue / Total Assets) X (Total Assets / Equity)
= Profit Margin X Asset Turnover X Leverage
The analysis showed that are three major financial metrics that drive ROE. These are operating efficiency, asset use efficiency, and financial leverage.
- Operating efficiency is represented by the Profit Margin. It indicates the amount of net income generated per dollar of sales.
- Asset use efficiency is measured by the Asset Turnover ratio and represents the sales amount generated per dollar of assets.
- Leverage is measured by the equity multiplier.
 |
| Chart 18: Sector DuPont Analysis |
The DuPont analysis showed that the main driver for the ROE is the Profit margin.
- In fact, over the past 12 years, there is a 1.00 correlation between the ROE and Profit Margin.
- For the Asset Turnover, the correlation is - 0.35 while it was - 0.26 for Leverage.
When I compared the performance of the steel industry in Malaysia with that of the US, I found that the low return was not just a Malaysian characteristic. Over the period from 2009 to 2020:
- The US steel sector had an average ROE of 2.98 %. (Source: Damodaran dataset for the period)
- The Bursa Malaysia sector had an average ROE of 0.04 %
The 12 years' ROE of both countries is shown below. The ROE for both these countries had a correlation of 0.45.
 |
| Chart 19: ROE - US Steel Sector vs Malaysia Steel Sector |
Gross Profit
In the iron and steel industry, the processing margin - the difference between raw materials and finished product prices - will generally widen when prices rise. Given this characteristic, you would expect this to be reflected in the gross profit and/or gross profit margins.
 |
| Chart 20: Sector Gross Profits |
As the charts illustrated, the gross profit and/or gross profit margins for the steel industry in Malaysia over the past 12 years show a wide variation. The sector average peak profit and/or margin was double that of the trough.
Note that the interquartile range has widened in the latter part of the analysis period. You can see this pattern for gross profit and gross profit margin.
Of course, the Covid-19 pandemic had narrowed the interquartile range a bit. Ignoring the pandemic, one interpretation is that the more profitable steel companies in Malaysia became relatively more profitable.
 |
| Chart 21: Sector Gross Profit Margin |
To illustrate the link between gross profit and/or gross profit margins and steel prices, I plotted them on the same chart as shown.
 |
| Chart 22: Gross Profit Indices vs Steel Price Index |
For the statistically-minded, from 2009 to 2020 the correlation between gross profit and the various steel prices were:
- - 0.30 for Hot roll steel. I suspect that the negative correlation is because hot-rolled steel tended to be the raw material. The gross profit improved as the hot-rolled steel prices decreased.
- 0.28 for steel rebar.
- 0.28 for cold-rolled steel
Note that the correlations were too low to have any statistical use.
Capital structure
The sector average total equity (SHF + MI) only grew at a 0.8 % CAGR from 2009 to 2020. You should not be surprised given the negligible accumulated profits from 2009 to 2020.
Compared to the PAT, the total equity of the sector was relatively stable.
 |
| Chart 23: Sector SHF + MI |
The steel industry in Malaysia was also very conservative when it came to debt. The sector average Net Debt to (SHF + MI) is 0.46. Net Debt for each company is defined as Debt less cash.
- 2 of the 21 companies had zero Net Debt for the whole 12 years.
- Only 4 companies had 12-years average Net Debt to (SHF + MI) ratio of more than 1.
 |
| Chart 24: Sector Net Debt to Total Equity |
Cash from operations
The cash from operations had a more favorable picture compared to PAT.
- Over the past 12 years, there was only one year where the sector average cash from operations was negative. Compare this with the sector average PAT which experienced 7 years of losses.
- I had earlier indicated that 7 companies had negative cumulative PAT from 2009 to 2020. Of these 7 companies, 5 had positive cumulative cash from operations for the same period.
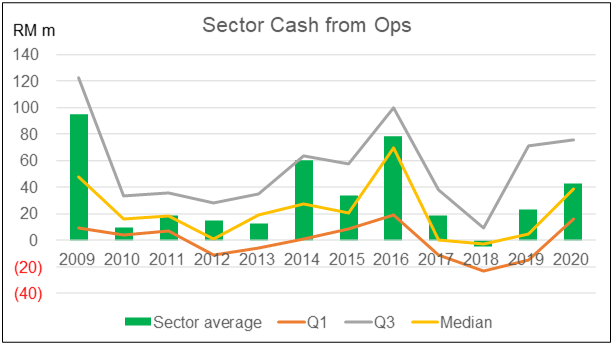 |
| Chart 25: Sector Cash from Ops |
The sector had average cash from ops to PAT ratio of 0.04. But this average hid the fact that there is a wide interquartile range for this ratio during the past 12 years
- The upper quartile ratios ranged from 0.4 to 3.5.
- The lower quartile ratios were in negative territory most of the time.
 |
| Chart 26: Sector Average Cash from Ops / PAT |
Note that I did not show the quartiles or median values in Chart 26 as they were of a different order of magnitude than the average. Including them in the same chart would make the average values hard to see as can be seen from the chart below.
 |
| Chart 27: Sector Cash from Ops / PAT with Interquartile Analysis |
Gross profitability
Gross profitability is defined as gross profit divided by total assets.
Professor Robert Novy-Max, University of Rochester, had done considerable research into this metric. According to him, it has roughly the same power as book-to-market in predicting the cross-section of average returns.
 |
| Chart 28: Sector Gross Profitability |
Over the period 2009 to 2020, the steel industry in Malaysia had average gross profitability of 9 %. You can see that the sector average gross profitability appears to have a similar profile as the gross profit.
Looking at the profile of the total assets, you can see that it was relatively stable. This meant that most of the variation in the gross profitability came from the variation in the gross profit. Given this, you should not be surprised that the gross profitability profile resembled that of the gross profit.
 |
| Chart 29: Sector Total Assets |
A significant part of the Total Assets was tied up in PPP. The chart below shows the profile of the PPE / Total Assets for the panel companies.
 |
| Chart 30: Sector PPE / Total Assets |
Valuation
To determine the investment opportunities for these 21 companies, I compared their gross profitability with the margin of safety based on the Graham Net-Net.
The Graham Net-Net is defined as Current Assets - Total Liabilities. It is often considered a shorthand for the liquidation values.
The margin of safety is based on the Graham Net-Net.
Margin of safety = (Graham Net-Net - Price) / Price X 100. A positive % meant that the market price was below the liquidation value.
If the company was profitable as indicated by high gross profitability, there is no reason for it to be liquidated. A positive % thus provides a good margin of safety.
The table below shows the valuation metrics for these 21 companies arranged in alphabetical order.
- You can see that there were 4 companies with a positive Graham Net-Net margin of safety. I took the market price as of 14 Sep 2021 as the reference price.
- The average gross profitability refers to the respective companies’ average gross profitability from 2009 to 2020.
 |
| Chart 31: Bursa Malaysia Steel Companies Valuation |
You can see that for these 4 companies with positive Graham Net-Net margin of safety, their respective gross profitability was around or higher than the sector’s 12-years’ average.
I am not suggesting that you invest in these 4 companies blindly. I am recommending that these 4 companies be candidates for further fundamental analysis if you are looking for a steel company in Malaysia to invest in..
Note that I have covered CSC in my blog. Refer to Is CSC Steel one on of the better Bursa stocks?
2023 Update
I also carried out an updated valuation based on the market prices as of 7 Jun 2023.
- The average gross profitability was based on 2009 to 2022.
- The Graham Net Net was based on the 2022 values. These were extracted from the Balance Sheet data of TIKR.com.
- The market prices of the various stocks were those as of 7 Jun 2023.
The results are shown in Chart 32. You can see that there are now 8 companies with positive margins of safety based on the Graham Net Net. The 4 companies identified in Oct 2021 were part of the 8 companies.
I am not suggesting that you invest in these 8 companies blindly. I am recommending that these 8 companies be candidates for further fundamental analysis if you are looking for a steel company in Malaysia to invest in.
If you compare Chart 32 with Chart 31, you can see that there has not been much changes in the average gross profitability.
But there were improvements in the Graham Net Nets. On a per share basis,
- In 2022, it ranged from - RM 0.50 to RM 3.04 with an average of RM 0.60.
- In 2020, it ranged from - RM 0.51 to RM 2.73 with an average of RM 0.48.
Of course, the market prices today were higher than those in 2021
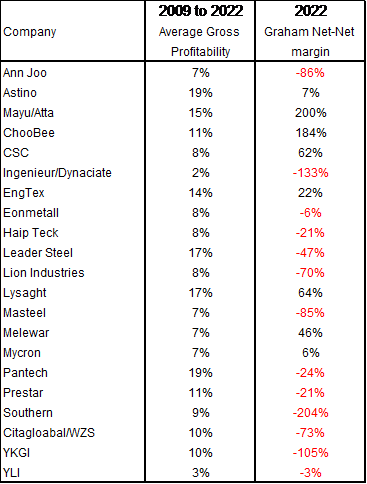 |
| Chart 32: 2023 Bursa Malaysia Steel Companies Valuation |
Methodology
I invest in iron and steel companies from a fundamental analysis perspective. As such having information about the industry performance can serve as base rates. If you want to understand more about base rates refer to the following articles:
Base rates are part of the data that you should use when undertaking a fundamental analysis. I hoped you can assess the performance of a particular company with the average and interquartile ranges. Furthermore, if a company is undergoing a turnaround, the base rates would also indicate what is likely.
As you can see, fundamental analysis is more than just using some formula. There are choices to be made in terms of which approach to use and what to assume.
So, if you are just starting to analyze and value companies, it may be helpful to supplement it with third-party analyses and valuation.
Several financial advisers provide such analyses.
Those who do this well include people like Seeking Alpha.* Click the link for some free stock advice. If you subscribe to their services, you can tap into their business analysis and valuation.
Data sources
The data for the base rates were extracted from the Financial Statements for each company for the period 2009 to 2020. Note that it is comprised of companies with different financial year ends.
The Financial Statements were taken from a platform/app called TIKR. It has been described as “The 1 Stop Platform To Do All Your Stock Market Research On”.
I have 2 types of analyses:
- The average of the sector. This is the average for the 21 companies making up the panel.
- The distribution of individual companies making up the panel. For these, I extracted the quartiles and median for each year based on the ranking of the respective metric for each year.
I have the following example to illustrate the difference between these 2 types of analyses.
Suppose that there are 9 companies in the panel with the revenue, PAT, and profit margin (PAT/Revenue) as shown in the table below.
 |
| Table 1: Sample panel |
To get the distribution of the profit margin, the companies were ranked (from largest to smallest) based on profit margin with the results as shown below. This was then used to determine the quartile and median values.
The average profit margin for the sector was derived by dividing the total PAT for the panel by the total revenue.
Sector average profit margin = 121 / 865 = 14.0 %.
You can also get the average profit margin by adding up individual company profit margin, ie 132.3, and dividing by 9 = 14.7 as shown in the table.
There are then 2 average profit margins for the panel.
- The 14.0 % is looking at the performance of the companies as a whole.
- The 14.7 % is looking at the distribution of individual profit margins.
The values are different because we are looking from different viewpoints. In my analysis, I am more interested in the former.
Presentation of information
I have presented the information in the form of charts as illustrated below:
- The sector average refers to the average for the 21 companies as illustrated by the 14.0 % computation in the previous section.
- Q1 refers to the first quartile value for the 21 companies.
- Q3 refers to the third quartile value for the 21 companies.
- Median refers to the median value for the 21 companies.
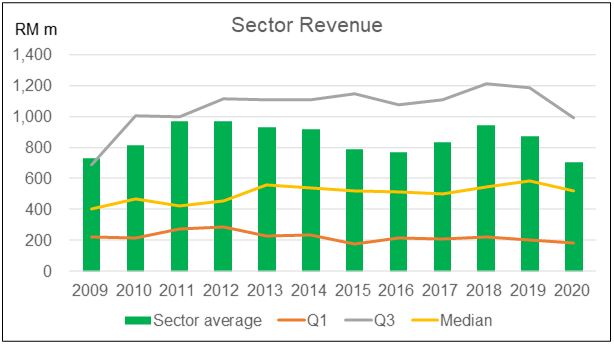 |
| Chart 32: Sector Revenue |
Appendix 1
There were 2 sources for my panel:
- Bursa Malaysia metal companies as listed by Malaysiastock.biz. I excluded those involved in non-ferrous materials such as copper and aluminum. I also excluded those in the precision engineering sector as the amount of material used was probably relatively small.
- Uncle Koon’s list. This was emailed to me by Uncle Koon.
There were 25 companies identified based on the above. Of these 4 did not have the full financials from 2009 to 2020.
a) List of companies with financials from 2009 to 2020 covered in the analysis.
b) List of companies left out as they did not have the full 2009 to 2020 financials
END
- - - - - - - - - - - - - - - - - - - - - - - - - - - - - - - - - -
How to be an Authoritative Source, Share This Post
|
Disclaimer & Disclosure
I am not an investment adviser, security analyst, or stockbroker. The contents are meant for educational purposes and should not be taken as any recommendation to purchase or dispose of shares in the featured companies. Investments or strategies mentioned on this website may not be suitable for you and you should have your own independent decision regarding them.
The opinions expressed here are based on information I consider reliable but I do not warrant its completeness or accuracy and should not be relied on as such.
I may have equity interests in some of the companies featured.
This blog is reader-supported. When you buy through links in the post, the blog will earn a small commission. The payment comes from the retailer and not from you.


Comments
Post a Comment