Is Pintaras one of the better Bursa construction stocks?
Value Investing Case Study 33-1: I invested in Pintaras about a decade ago achieving a good return. In this post, I carried out an updated fundamental analysis to determine whether there is an opportunity for another round of investment.
Pintaras Jaya (Pintaras or the Group) is a Bursa Malaysia construction company. I first invested in Pintaras in 2010 but had sold off all my shareholdings by 2014 with an 82% compounded annual gain.
The market price today appears to have fallen below my earlier estimates of intrinsic value. I wanted to see whether there is another opportunity to invest in Pintaras.
The Group today is different from what it was in 2010 having ventured into Singapore a couple of years ago. Given this, I thought that a fresh fundamental analysis would be useful.
Join me as I establish my Investment Thesis for Pintaras. Should you go and buy it? Well, read my Disclaimer.
To be transparent, I have dealt with Pintaras, as it is one of the foundation contractors in the development of i-City.
Contents
- Investment Thesis
- Background
- My Investment History
- Fundamentally sound
- Prospects
- Shareholders Value Creation
- Valuation
- Conclusion
|
Investment Thesis
Pintaras’ performance in Malaysia over the past few years had been affected by the slowdown in the property and construction sector. This was aggravated by the government measures to control the Covid-19 pandemic. As such the bulk of the contribution over the past few years has been from its Singapore operations.
As the leading foundation and sub-structure contractor in Malaysia, I expect the Group to rebuild back the Malaysian business. The Group would then be firing on all cylinders and be re-rated.
At the current price of RM 2.22 (9 Aug 2022), there is a sufficient margin of safety.
|
Background
Pintaras is the leading piling and foundation specialist in Malaysia. It has about 30 years of experience in the local construction sector. The Group expanded to Singapore in 2018.
Its geotechnical expertise in piling systems, sub-structure, and basement works enabled the Group to carve a niche in Malaysia. However, its Malaysian contribution over the past few years has declined from its historical high. Refer to Chart 1. The revenue growth over the past few years was due to its Singapore operations.
 |
| Chart 1: Revenue Profile |
The Group has two business segments:
- Piling, civil engineering, and construction (Construction).
- Manufacturing. The Group has a metal container manufacturer that specializes in industrial pails and cans for the paint industry.
As can be seen from Chart 1, the main contribution has been from the Construction segment.
My Investment History
I first bought Pintaras in 2010 at an average price of RM 1.68 per share. When the price went up in 2013, I sold half of my investment at an average price of RM 4.85 per share.
The company then undertook a 1:1 bonus issue. Of course, the price per share went down after the bonus issue.
 |
| Chart 2: Price history Source: TIKR.com |
In 2014, the price began to spike and I sold all of my post-bonus investments at an average price of RM 3.58 per share. I had held onto the shares for about 4 years and during this period, I also benefited from the dividends. Overall including dividends, I made an 82 % compounded annual return. Dividends accounted for about 1/10 of the returns.
Fundamentally sound
Pintaras is a founder-led Group where the founder and his wife are still executive directors. I rate the Group as fundamentally sound for the following reasons:
- The Group is financially strong.
- It has a good operating track record.
- It is one of the better performers in the industry.
- It has a good Q-Rating.
Financially strong
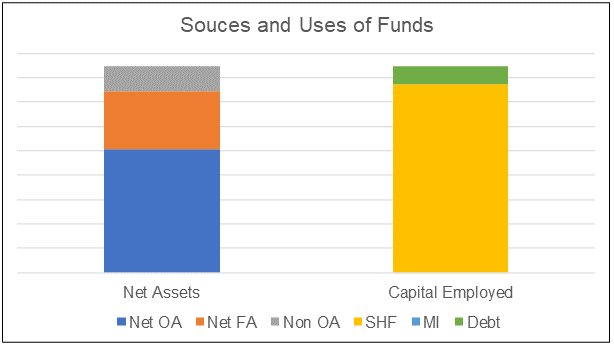
As of the end of March 2022, the Group has a Total Capital Employed (TCE) of RM 424 million. About 91% of the TCE was funded by equity with the balance from debt/leases. About 60% of the TCE is used for operations with the balance mainly in cash or securities.
 |
| Chart 3: Sources and Uses of Funds |
Over the past 12 years, the Group had generated positive Cash Flow from Operations every year. The Group had achieved a positive Free Cash Flow every year over the past 12 years. Note that this was computed simply as Cash Flow from Operations – Cash Flow in Investment.
Performance Index
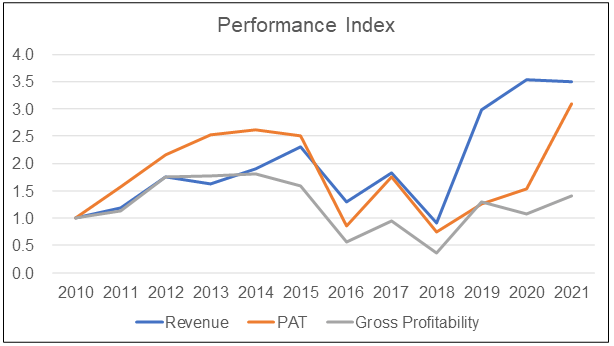
The Group has been profitable every year over the past 12 years with a time-weighted average ROE of 11.7 %.
As can be seen from Chart 4, Revenue, PAT, and Gross profitability increased from 2010 to 2014/15. They then declined but had shown an uptrend since 2018. This was due to the expansion into Singapore.
The performance of these 3 metrics currently is better than those in 2010.
 |
| Chart 4: Performance Index |
Peer comparison
In my article “Making sense of the Bursa Malaysia construction sector”, I presented some statistics on the Malaysian construction sector.
You can see that the sector had faced declining PAT since 2015/16. The sector average gross profitability has not shown any uptrend since 2010. Pintaras Malaysian operations were not immune to this as can be seen from Chart 1. Its expansion into Singapore turned the business around in 2019.
A comparison of Pintaras with the average performance of the sector (denoted by Malaysian in Charts 5 and 6) shows that Pintaras had performed better.
 |
| Chart 5: Revenue and PAT comparisons |
 |
| Chart 6: ROE and Gross Profitability comparison |
Q-Rating
The Q-Rating is my quality and risk rating system. For further details on how I compute this rating, refer to “How To Mitigate Risks When Value Investing”.
Chart 7 summarizes the Q-Rating for Pintaras. With an overall rating of 0.67, it falls into the upper quartile ranking of companies. In other words, Pintaras is among the better-rated companies. You can see that it is very strong financially and scores well in terms of low risk and profitability.
 |
| Chart 7: Q Rating |
Prospects
The Group does not provide any breakdown of its results by region. It only does so by the business. I estimated the returns for each of the businesses as shown in Table 1
The Group only achieved a return (defined as EBIT/TCE) of 10 %. But this was because about 41% of the 2021 TCE generated very low returns. This was under the “Others” segment and comprises mainly cash and securities.
Looking at the returns from the operations, you can see that both the Construction and Manufacturing segments generate very good returns.
Referring to Chart 1, the Malaysian Construction component is currently not running at its historical high. There is the prospect of increasing the average revenue from this component by 50%. I estimated this by comparing the past 12 years’ average revenue with the 2012 to 2015 average.
When this happens some of the TCE under the “Others” would be transferred to the Construction segment. While the return from this segment may not change much from the average 17% as shown, the quantum of EBIT would increase. The overall return would be better.
There is also the hope that the Group could redeploy some of the cash into new ventures. Of course, my preference is to return some of it to shareholders if the Group does not have any use for it.
I hasten to add that there is still growth in the Malaysian construction sector.
According to the Department of Statistics Malaysia, the Malaysian construction industry expanded by 40.3% year on year in Q2 2021. This was supported by growth in specialized construction activities and building construction, offsetting the weakness in civil engineering construction works.
In line with the opening of the economy in 2022, I expect the sector to continue to grow and achieve the following forecasts:
- “The construction industry is expected to register an annual average growth rate of 6.8% between 2022 and 2025” Construction in Malaysia - Key Trends and Opportunities to 2025, Market Research.com
- “Malaysia Construction Market is expected to grow at a CAGR of approximately 6% during the forecast period 2022-2027.” Mondor Intelligence
Shareholders Value Creation
I looked at the following metrics to determine whether a company can create shareholders’ value:
- Comparing its ROE with its cost of equity.
- Comparing its returns assuming that no dividends were paid with the WACC.
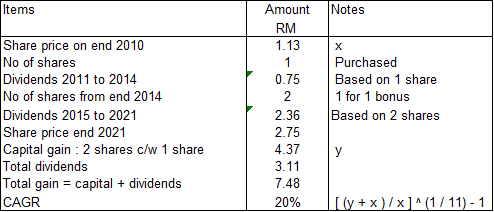
- Looking at the total gain achieved by a long-term shareholder.
- The Q-Rating.
As can be seen from Table 2, the various returns achieved by Pintaras exceeded the respective cost of funds. At the same time, I have shown earlier that Pintaras achieved a good Q-Rating.
I would conclude that the Group has been able to create shareholders’ value.
 |
| Table 3: Shareholders gain |
Valuation
I valued Pintaras based on both the Asset Value and the Earnings Value.
- The Asset Value is broken down into the Graham Net-Net and Book Value. Note that in the case of Pintaras, the NTA = Book Value.
- The Earnings Value is broken down into the Non-Operating Assets and the Earnings Power Value (EPV).
The EPV that were derived based on the average of 2 methods.
- The discounted Free Cash Flow to the Firm model.
- The discounted Residual Income model.
The values of the cash flow and residual income were based on the time-weighted average values from 2010 to 2021. These are conservative estimates. For example:
- The weighted average EBIT was RM 44 million compared to the 2021 EBIT of RM 76 million.
- The weighted average Residual income was RM 25 million compared to the RM 49 million Residual income in 2021.
The valuation of Pintaras is summarized in Chart 8.
Asset Value = RM 2.33 per share.
EPV = RM 4.55 per share.
The EPV is based on the perspective that the future is similar to the past. If you believe that the future is going to be better given the Singapore business, then the estimated EPV would be higher. If you believe that the future is going to be worse, then the EPV is over-estimated.
In any event, because of the large non-operating assets, I believe that the Asset Value provides a strong floor value.
 |
| Chart 8: Valuation |
The EPV is very much higher than the Asset Value. According to Professor Bruce Greenwald, for this to be valid, it must mean that the Group has some sustainable competitive advantage.
I believe that Pintaras advantage is its geotechnical expertise. Based on my personal experience, the Group in the past had been very choosy about the types of jobs and customers. They do not compete for the “straightforward” piling works. Rather they focus on those where their geotechnical expertise and experience gave them some advantage. This enabled them to sustain their margins.
As you can see there is about a 95 % margin of safety based on the EPV at the current market price of RM 2.32 (as of 8 Aug 2022).
|
Conclusion
The Group is fundamentally strong.
- It is financially strong.
- It has a good operating track record.
- It is one of the better performers in the industry.
- It has a good Q-Rating.
The Group has also been able to create shareholders’ value.
Although it had achieved an overall return (EBIT/TCE) of 10 %, this was because the returns from cash and securities were very low. Given that these accounted for 41 % of the TCE, I would conclude that not all its cylinders were firing.
Over the past few years, the contribution from Malaysia was low. This was because of the soft property and construction market. The Malaysian property and construction market will eventually turn around. When this happens, I expect its Malaysian Construction segment to benefit.
Based on the weighted average performance, I had estimated that the EPV provides a 95% margin of safety.
Given all the above, I would conclude that Pintaras is one of the better Bursa construction stocks to invest in.
End
- - - - - - - - - - - - - - - - - - - - - - - - - - - - - - - - -
How to be an Authoritative Source, Share This Post
|
Disclaimer & Disclosure
I am not an investment adviser, security analyst, or stockbroker. The contents are meant for educational purposes and should not be taken as any recommendation to purchase or dispose of shares in the featured companies. Investments or strategies mentioned on this website may not be suitable for you and you should have your own independent decision regarding them.
The opinions expressed here are based on information I consider reliable but I do not warrant its completeness or accuracy and should not be relied on as such.
I may have equity interests in some of the companies featured.
This blog is reader-supported. When you buy through links in the post, the blog will earn a small commission. The payment comes from the retailer and not from you.


Comments
Post a Comment