Was Tower REIT an investment mistake?
Value Investing Case Study 36-1: A fundamental analysis of Tower REIT to determine what to do with this loss-making investment.
I bought 135,000 units of Tower REIT about a decade ago at an average cost of RM 1.32 per unit. This was at about a 23 % discount to the average Book Value then of RM 1.72 per unit. The Dividend Yield based on the purchase price was 8.3 %.
You would have thought that there was a sufficient margin of safety given the discount on the Book Value and the high Dividend Yield. Unfortunately, this was not the case as the current market price of Tower REIT had declined to RM 0.47 per unit (as of 23 Nov 2022).
There was no new issuance of units since I bought them. As such the declining unit price would be due to both operating problems as well as market sentiments.
Join me as I explore the reasons for the decline and gauge the prospects of a recovery. I will then determine what to do with this investment. Do I hold expecting it to recover or do I cut loss?
You would be surprised at the answer – continue to hold.
Should you go and buy it? Well, read my Disclaimer.
Contents
- Investment Thesis
- Background
- Sources and Uses of Funds
- Financial Performance
- Peer Performance
- Unitholder’s gain
- How to handle a price decline
- Conclusion
- Appendix 1 – Peer Lists
|
Investment Thesis
I originally invested in Tower REIT a decade ago on the basis that its market price of RM 1.32 per unit was at a 23 % discount to its Book Value. As a REIT, the Book Value is a good indication of the intrinsic value.
There was also an 8.3 % Dividend Yield based on its purchase price. At the same, I estimated the value based on the Funds Flow from Operations (FFO) per unit to be RM 1.27.
The price of Tower REIT is today RM 0.47 per unit. This is due to a combination of declining performance and negative market sentiments. There was no change in the number of units during this period. The decline in the performance per unit was due to a reduction in the occupancy and average rental per sq ft.
The property market is cyclical and currently at the bottom of the cycle. I expect the demand for office space to uptrend and peak in the next decade. When this happens, the performance of Tower REIT will improve. Then the market price of Tower REIT units will experience a corresponding uptrend.
Together with the Dividends, this will provide a better total gain than selling off now to invest in another under-price stock.
|
Background
Tower REIT is a real estate investment trust that was established to invest in prime office and commercial real estate assets.
In 2007, Tower REIT diversified its portfolio objectives to allow for investments in residential and industrial real estate. This was aimed at allowing the Trust to capitalize on broader market opportunities and enhance its growth prospects.
The Trust’s overarching investment objectives remained unchanged – namely, to invest primarily in a portfolio of high-quality real estate, including office buildings, commercial, residential and industrial properties, to:
- Provide Unitholders with regular and stable distributions; and
- Achieve medium to long-term growth in its NAV per unit.
The REIT is managed by GLM REIT Management Sdn Bhd, a wholly-owned subsidiary of GuocoLand (Malaysia) Berhad – the property arm of the Hong Leong Group. The current Trust structure is summarized in Chart 1.
 |
| Chart 1: Current Trust Structure |
Portfolio history
When I first bought the units in 2011, Tower REIT had 3 Portfolio Assets – Menara HLA, HP Towers, and Menara ING. A brief history of Tower REIT since then is as follows:
- Menara ING was sold off in 2015.
- HP Tower was renamed Plaza Zurich in 2016 following the entry of Zurich Insurance as the anchor tenant for the building.
- In March 2020, Menara HLA was renamed Menara HLX to reflect its status as the home of HLX.
- In August 2020 (FYE 2021), Tower REIT acquired Guoco Tower.
Chart 2 shows the changes in the Portfolio Assets.
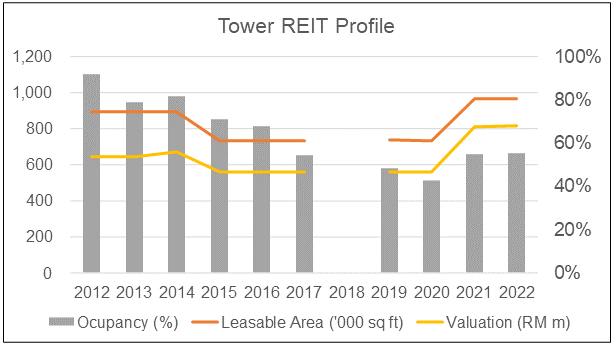 |
| Chart 2: Tower REIT Portfolio Profile Note: There was a change in the FYE 2018/2019 from Dec to Jun. As such, there is no Annual Report for 2018. |
Current Portfolio
Tower REIT’s current portfolio consists of three prime commercial buildings with a combined appraised value of approximately RM818.6 million as of 30 June 2022. The combined total net lettable area of the portfolio is 966,157 sq ft. Refer to Chart 3.
 |
| Chart 3: Tower REIT Current Portfolio |
Sources and Uses of Funds
Tower REIT is funded by a combination of Equity and Debt. The amount that Tower REIT can borrow is guided by the following:
“Total borrowings of the Trust shall not exceed 50% of the Total Asset Value (TAV) at the time the borrowings are incurred or such other levels as may be permitted ed by the SC Guidelines on Listed REITs.” Source 2021 Annual Report
It currently has a Debt Equity ratio of 0.52 and a Debt TAV ratio of 0.33. As can be seen from Chart 4, Tower REIT has kept well below the Debt limit. For most of 2015 to 2020, there were very few borrowings. This was because the loan in 2014 was settled by the sale of Menara ING in 2015. The increase in Debt in 2021 was to fund the purchase of Menara Guoco.
 |
| Chart 4: Sources of Funds |
As can be seen from Chart 5, the bulk of the funds has been used for real estate assets.
 |
| Chart 5: Uses of Funds Note: The Net Current Assets here refer to Current Assets – Current Liabilities excluding Cash – Other Long-Term Liabilities. |
Financial Performance
The financial performance of Tower REIT had been declining since my purchase. From 2012 to 2022 on a per-year compounded basis,
- Revenue declined by 5.2 %.
- PAT declined by 23.1 %.
- FFO per unit declined by 8.7 %.
Refer to Chart 6. Note that I defined FFO = PAT + Depreciation – Gain from Asset Disposal – Gain from Asset Revaluation Surplus.
- The increase in revenue in 2019 compared to 2017 was due to the change in the financial year that comprised of 18 months performance for FYE 2019. There was hardly any revenue growth if you compare them on 12 months annualized basis.
- While revenue increased in 2021 compared to that for 2020, PAT declined. This was because of an asset write-down of RM 12.4 m in 2021.
 |
| Chart 6: Topline and Bottomline Performance |
|
By comparing Chart 2 and Chart 6, you can see that the decline in the revenue and PAT was due to declining occupancy.
- Menara HLX occupancy declined from 99 % in 2012 to 26 % in 2022.
- Plaza Zurich occupancy declined from 80 % in 2023 to 66 % in 2022.
The overall occupancy declined from 92 % in 2012 to 55 % in 2022. Note that we are not comparing apple-with-apple throughout the period as there were changes in the Portfolio Assets during this period.
- Menara ING was sold off in FYE 2015. Tower REIT was thus left with 2 buildings.
- Menara Guoco was acquired in FYE 2021 so Tower REIT had 3 buildings currently.
The overall Portfolio occupancy reached its trough of 43% in 2020. The main contribution to the growth in occupancy in 2021 was due to the 95 % occupancy of the newly purchased Menara Guoco.
But the challenges facing Tower REIT were not just the declining occupancy. It also suffered a decline in the average monthly rent per sq ft. Refer to Chart 7.
The positive sign is that the average monthly rent per sq ft and occupancy showed improvements from the trough in 2020. But they are far from the 2012 values. From 2012 to 2022, on a per-annum compounded basis,
- Overall occupancy declined by 5.2 %.
- Average monthly rental declined by 6.0 %.
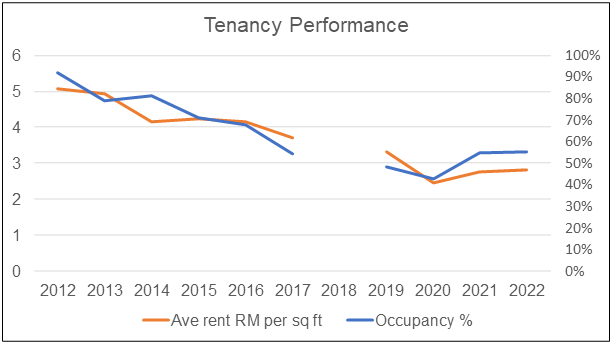 |
| Chart 7: Tenancy Performance Note: The rental per sq ft in 2019 was annualized to 12 months. |
Peer Performance
Charts 8 and 9 compared Tower REIT’s performance with those of a sample of Bursa Malaysia REITs. These comparisons enabled me to determine whether Tower REIT’s declining performance was due to the market or its problems.
There were 18 companies including Tower REITs in the peers. Refer to Appendix 1 for the list of REITs. Note that I covered the 2012 to 2021 period for the Peer comparison.
In the Charts, the central tendency was presented as mean and median. The range was represented by the upper quartile (Q3) and lower quartile (Q1).
Not all 18 companies had data starting from 2012. As such for the central tendency, I used the median as the main metric. The missing data does not significantly affect the quartile values.
Refer to “Hunting for Bursa REITs to invest in” for more analysis on the Bursa Malaysia REITs and the method used in the analysis.
 |
| Chart 8: Peer Revenue and PAT |
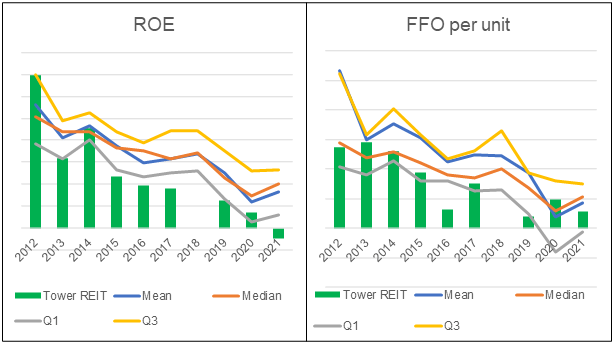 |
| Chart 9: Peer ROE and FFO per unit |
A summary of the comparison is presented in Table 1. From 2012 to 2021,
- The panel median revenue grew at a CAGR of 2% whereas Tower REIT revenue declined at a 6 % compounded annual rate.
- Tower REIT’s PAT, ROE, and FFO per unit declined much more than those for the panel median.
In terms of the average ROE from 2012 to 2021, the panel had a better return of 6.7 % compared to Tower REIT’s return of 5.0 %.
Overall, I would conclude that Tower REIT had an even worse performance than it peers. It was not just an industry issue.
 |
| Table 1: Summary of Peer Comparison |
Unitholder’s gain
I defined my gain as a unitholder = Capital gain + Dividends.
Where:
Capital gain = difference between current market price and purchased price. This is influenced by the REIT performance as well as the market sentiments.
Dividends = total Dividends from the start of 2012 to 2022. The Dividends paid are dependent on the performance of the REIT.
Chart 10 illustrates the Earnings per unit, Dividends per unit, and the FFO per unit for Tower REIT from 2012 to 2022. You should not be surprised to see declining Dividends per unit paid given the declining Earnings per unit and FFO per unit.
From 2012 to 2022, the market price of Tower REIT declined from RM 1.32 per unit (assumed to be my average purchase cost) to RM 0.47 per unit (as of 23 Nov 2022). You should not be surprised by this declining price given the declining performance.
 |
| Chart 10: Earnings vs Dividends |
Over the 2012 to 2022 holding period, my investments delivered a compounded annual loss of 1.8 %. This took into account both the Capital Gain and the Total Dividends received. Table 2 illustrate the computation.
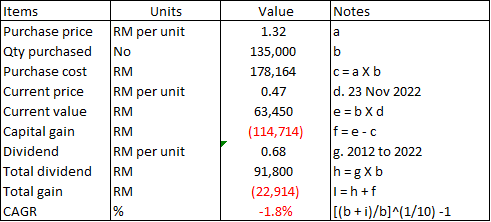 |
| Table 2: Computation of Unitholders' Gain Note: The Dividend was extracted from the TIKR.com platform. I have assumed that the holding period is 10 years. |
Projected unitholder’s gain
Imagine achieving a compounded loss over the 10 years holding period.
To see whether it is worthwhile to continue to hold, I projected the best-case scenario based on the following assumptions.
- Best price would be achieved in 8 years ie 18 years total holding period.
- I assumed that the market price would retrace its historical pattern. As such, I took the Dec 2014 market price as the projected price in 8 years. The market price then was RM 1.22 per unit.
- I assumed the Dividend to retrace its historical pattern. The Dividend for the next 8 years is thus those from 2015 to 2022 of RM 0.38 per unit. The cumulative Dividends received for 18 years is then RM 1.06 per unit.
Based on these, I would achieve a 3.8 % CAGR from 2012 to 2030. Refer to Table 3.
 |
| Table 3: Computation of Unitholders' Gain - Best Case Scenario |
What are the factors for the positive outlook under the best-case scenario?
- The occupancy and rental yield have moved up from the trough.
- Tower REIT has the option to invest in residential and industrial estates.
- Assuming that the Book Value in 2030 is the same as the current one of RM 1.86 per unit, there is a 1/3 discount to the projected market price of RM 1.22.
How to handle a price decline
In my article “Parkson Holdings - how to handle a price decline” I presented a framework for determining what to do in cases where the price had declined substantially.
This is summarized in Chart 11.
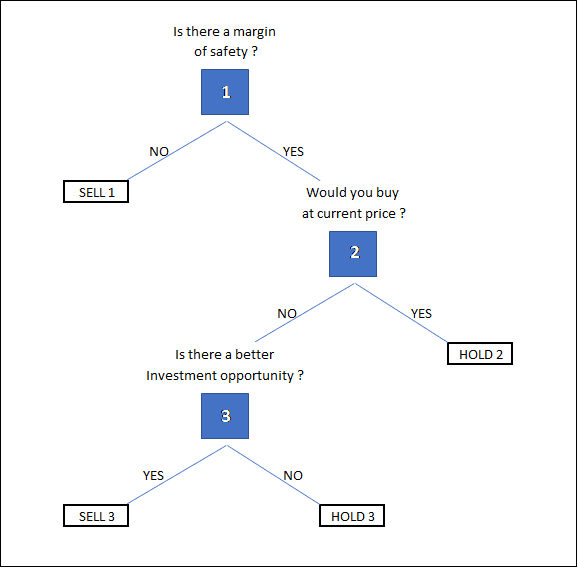 |
| Chart 11: Hold or Exit Decision Framework |
You can see that there are 3 Decision stages (denoted by the blue box), 2 Sell positions and 2 Hold positions.
Decision 1. When the price drops below your purchased cost, the first question you need to ask is whether your cost is still lower than the intrinsic value. You should review the intrinsic value to cater to the changing prospects.
Decision 2. If there is still a margin of safety, you should ask whether the business is a buying opportunity if you did not own any units. You would analyze the business prospects as well as the downside risk. I have this step to avoid the various behavioral biases.
Decision 3. The reason to sell and incur the loss is that you think you can make better returns with other stocks. But this is not guaranteed. You want to check that the returns from an alternative investment far outweigh the prospects of the stock turning around.
Sell 1. The sell decision is because the intrinsic value had declined to be below your purchased cost. From a value investment perspective, it would be tough for the price to rise above the intrinsic value.
Sell 3. The sell decision is because you are more likely to make money from the alternative investment than with the existing stock. This is even if the purchased cost is lower than the intrinsic value.
Hold 2. You hold because this is still a good investment.
Hold 3. While you would not buy more, you hold because it is still better than alternative investments.
Tower REIT case study
Stage 1
The current market price is below my purchased cost and my best-case scenario showed that I could achieve a CAGR of 3.8%. This is about the same return I could get by keeping my money with the Malaysian Employees Provident Fund.
However, assuming the Book Value is a good indication of the intrinsic value, there is a margin of safety at the current market price of RM 0.47 per unit. Based on the RM 0.02 Dividend per share, there would be 4.3 % Dividend Yield. I would proceed to Stage 2.
Stage 2.
There were two issues to consider - the business prospects and the financial risks. There is no financial risk as Tower REIT could generate sufficient funds to pay the interest charges and Dividends.
In the case of Tower REIT, the turnaround will depend on the recovery of the property market, in particular the demand for office space. My best-case scenario depended on this. At this juncture, I would not buy Tower REIT. This would bring me to Stage 3.
Stage 3.
Over the past 20 years, I have achieved a compounded 10 % total return with my stock portfolio. Based on this, and assuming no dividend, it would mean doubling the unit price in about 7 to 8 years. I used this as the alternative investment benchmark.
If I sell Tower REIT now at RM 0.47 per unit to invest in another underpriced stock, on a per-unit basis:
- I would lose = RM 22,914 / 135,000 = RM 0.17 per unit. This includes Capital Loss + Dividend. Refer to Table 2.
- The gain from the alternative investment = RM 0.47 per unit ie based on doubling my investment.
- There would thus be a net gain of RM 0.47 – RM 0.17 = RM 0.30 per unit.
But in Table 3, I have shown that Tower REIT could generate a total gain of RM 129,363 / 135,000 = RM 0.96 per unit if I continue to hold. This is more than the RM 0.30 per unit gain from selling now.
The risk is whether Tower REIT could achieve Capital Gain and Dividends in 7 to 8 years. It does not look impossible. As such I should continue to hold?
Conclusion
Tower REIT had 2 goals:
- Provide Unitholders with regular and stable distributions.
- Achieve medium to long-term growth in its NAV per unit.
My analysis showed that it did not deliver these 2 goals from 2012 to 2022. The annual dividend had declined from RM 0.12 per unit in 2012 to RM 0.02 per unit in 2022. The Book Value had grown by a 0.2 % CAGR.
From a unitholder’s perspective, from 2012 to 2022, I had a total loss. My loss was at 1.8 % per year compounded basis.
Based on these, I would conclude that my investment in Tower REIT was a mistake.
But based on my hold-exit decision-making framework, I should not exit. The potential gain from a recovery of the property market far outweighs the potential gain from selling now and investing in other undervalued stocks.
It is ironic – it is an investment mistake, but it is better to hold on than cut loss.
Appendix 1 – Peer REITs
End
- - - - - - - - - - - - - - - - - - - - - - - - - - - - - - - - -
How to be an Authoritative Source, Share This Post
|
Disclaimer & Disclosure
I am not an investment adviser, security analyst, or stockbroker. The contents are meant for educational purposes and should not be taken as any recommendation to purchase or dispose of shares in the featured companies. Investments or strategies mentioned on this website may not be suitable for you and you should have your own independent decision regarding them.
The opinions expressed here are based on information I consider reliable but I do not warrant its completeness or accuracy and should not be relied on as such.
I may have equity interests in some of the companies featured.
This blog is reader-supported. When you buy through links in the post, the blog will earn a small commission. The payment comes from the retailer and not from you.


Comments
Post a Comment