Do I swap my office REIT with Hektar REIT?
Value Investing Case Study 38-1: A fundamental analysis of Hektar REIT to see whether it is beneficial to replace my office REITs with this.
I have 3 REIT investments – Tower REIT (Tower), AmFirst REIT (AmFirst) and Hektar REIT (Hektar). In total, I had invested about RM 634,500 in the 3 REITs over the past 12 years.
Tower is an office REIT while Hektar is a retail REIT. AmFirst is a mixed REIT with 57 % office, 34 % retail, and 9 % hospitality by lettable area.
The market prices of all three REITS have declined significantly compared to my purchased prices. The price decline was partly due to the declining rentals and occupancy resulting from the soft property market. Part of the price decline was of course due to the negative market sentiments.
When it comes to the property market, the demand for offices is driven by different factors compared to those for retail and hospitality. As such you would expect different recovery rates for these sectors.
My original goal for investing in the REITs was for the dividends rather than the capital gain. This has not changed. However, given that the 3 REITs have different sector exposure, should I re-balance among them?
More specifically, we know that the office market is more challenging. Should I swap the Tower investment with either Hektar or AmFirst? This will reduce my office exposure in favour of the retail.
Join me as I explore this option. Should you go and buy the retail REIT? Well, read my Disclaimer.
Contents
- Hektar Profile
- Unitholders Performance
- My own REITs
- Should I swap?
- Sector outlook
- Conclusion
|
I had previously covered Tower and AmFirst. Refer to:
I will start by first providing similar analyses for Hektar before comparing them. I will next see whether there is any benefit from reducing the office sector exposure in favour of the retail sector.
Hektar Profile
Hektar was listed on the Main Board of Bursa Malaysia in December 2006. From 2 properties with about 1 million sq ft of lettable area, it has grown to currently 5 properties with about 2 million sq ft of lettable area. Refer to Chart 1. As can be seen, Hektar invests in income-producing real estate used for retail purposes.
 |
| Chart 1: Properties under Hektar |
Hektar strategic partner is Frasers Centrepoint Trust, part of the Frasers Property Group, headquartered in Singapore.
While Hektar has grown its properties – lettable area and valuation – over the years, its occupancy has declined. Refer to Chart 2.
 |
| Chart 2: Hektar Profile Notes a) Added Central Square and Landmark Central in 2012. b) Added Segamat Central in 2017. c) Landmark Central renamed Kulim Central in 2017. |
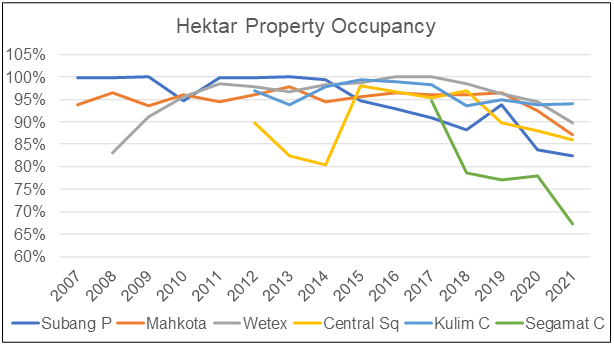
The drop in occupancy started before the Covid-19 period. As can be seen from Chart 3, this is a common feature among all its properties.
Financial performance
The financial performance of Hektar can be considered mixed. While Revenue and FFO in 2022 were higher than those in 2007, PAT was lower. Refer to Chart 4.
From 2007 to 2022 on a per-year compounded basis:
- Revenue grew by 2.6 %. There was a significant drop in 2020 and 2021 due to Covid-19 with some recovery in 2022.
- Funds Flow from Operations (FFO) grew by 1.8 %. Note that I defined FFO = PAT + Depreciation – Gain from Asset Disposal – Gain from Asset Revaluation Surplus.
- PAT declined by 182.1 %. Note that a significant portion of this was due to revaluation losses in 2015, 2020, and 2021. This was despite a major revaluation gain in 2011.
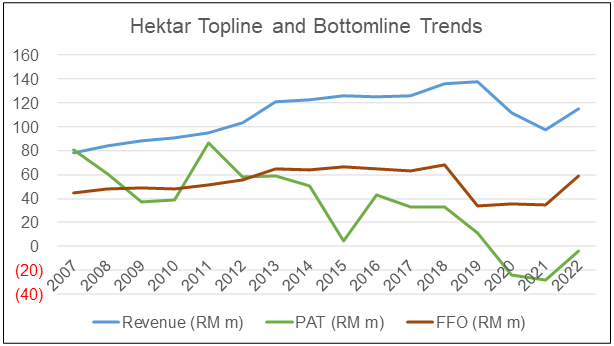 |
| Chart 4: Topline and Bottomline Trends Note: The 2022 performance was based on Sep 2022 LTM results. |
We can trace the financial performance to the declining tenancy performance. As per Chart 5, you can see that the rental per sq ft and occupancy had been declining.
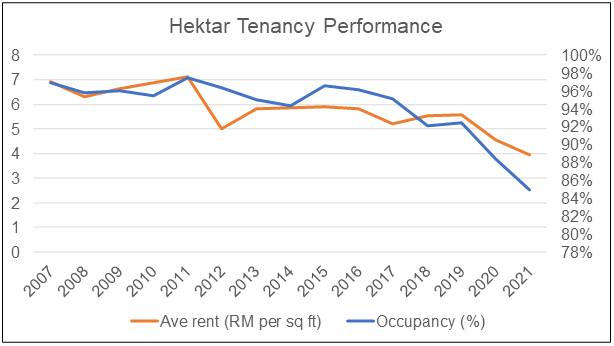 |
| Chart 5: Tenancy Trends |
Sources of funds
I have previously described how REITs do not have much-retained earnings to fund their growth. Rather they require a combination of debt and new capital to fund growth. Refer to “What to consider when investing in REITs”.
Hektar is no different as shown in Chart 6. There were significant increases in both debt and equity in 2012 and 2017 in line with the increase in net lettable area.
 |
| Chart 6: Sources of Funds Trends |
Unitholders Performance
The number of units in Hektar increased from 320 million units in 2007 to 469 million units in 2022 while the financial performance deteriorated. This meant that on a per unit basis, unitholders were worse off in 2022 compared to 2007. Refer to Chart 7.
You can see that Earnings per unit and FFO per unit declined. This then led to a declining Dividend per unit. Certainly not an exciting picture for a unitholder who bought them in 2007.
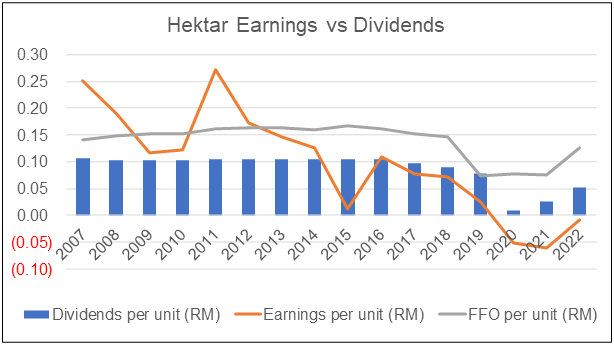 |
| Chart 7: Value to Unitholder Note: The 2022 performance was based on Sep 2022 LTM results. |
I had originally bought 128,500 units of Hektar with a weighted average holding period of 7.71 years as of 28 Dec 2022.
In my previous article, “What to consider when investing in REITs”, I showed how to compute a unitholder’s return. I used the same approach to compute my return for Hektar based on my purchases. Refer to that article for details.
On such a basis, my investment in Hektar had delivered a compounded annual loss of 3.8 % over the past 7.71 years. Table 1 illustrates the computation.
 |
| Table 1: Estimating my Return |
Projected unitholder’s gain
To see whether it is worthwhile to continue to hold, I projected the best-case scenario for Hektar based on the following assumptions.
- Best price would be achieved in 8 years ie 15.71 years total holding period.
- I assumed that the market price would retrace its historical pattern. As such, I took the Dec 2014 market price as the projected price in 8 years. The market price then was RM 0.90 per unit.
- I assumed the Dividend to retrace its historical pattern. The Dividend for the next 8 years is thus equal to those from 2015 to 2022.
Based on these, I would achieve a 3.1 % CAGR based on 15.71 years of holding period. Refer to Table 2.
 |
| Table 2: Estimating my Projected Return |
My own REITs
In total, I had invested about RM 634,500 in the 3 REITs. Chart 8 illustrates the breakdown of the total investment based on the original cost. You can see that Tower was the smallest investment.
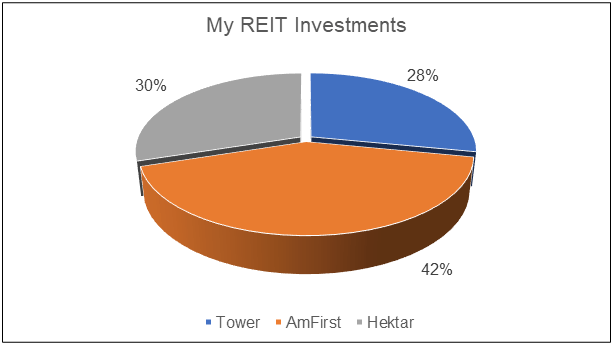 |
| Chart 8: My Own REIT Investments |
Each of the REITs had its sector profile based on the lettable area, valuation, and rental. To derive the overall profile,
- I first derived the sector investment for the respective REIT.
- I next sum the amount in each sector for the 3 REITs.
- The % in each sector was derived by dividing the sector amount apportioned by RM 634,500.
Table 3 summarizes the overall profile.
 |
| Table 3: Overall Performance of My Own REITs |
You can see that slightly more than half of my investments are in the office sector while the retail sector accounted for about 2/5 of my investment. The balance was in hospitality (hotel).
Comparative Performance
You can see from Table 4 that the financial performance of the 3 REITs deteriorated from 2012 to 2021. AmFirst with its mixed sector profile deteriorated the least.
 |
| Table 4: Past Decade Performance |
From a unitholder's perspective, AmFirst delivered the best compounded annual gain as summarized in Table 5. Refer to the respective articles for details of the computation.
But assuming a recovery in the property market over the next 8 years, Hektar would deliver the lowest gain. The main reason for this is that Hektar’s purchased price does not provide any margin of safety based on its current Book Value. Refer to Table 6.
If so, is there any reason to swap Tower with Hektar? A better bet would be to swap Tower with AmFirst.
My main concern with swapping Tower with AmFirst is that AmFirst is at its maximum Debt to Total Assets ratio. In other words, AmFirst growth will have to be funded by new capital.
AmFirst current market price is significantly below my average purchased price. As such the new capital would not be value accretive to the existing unitholders. Refer to Table 7 for the summary. For discussions on the dilutive impact, refer to “What to consider when investing in REITs”
|
Should I swap?
The decision on whether to swap Tower with AmFirst or Hektar would depend on the financial impact.
If I sell Tower to invest in AmFirst, there would be a loss in Tower from the sale. Is the net gain (capital gain and dividend less the loss from the sale of Tower) better than holding onto Tower?
Table 8 summarizes the comparative gains. It showed that I am better off not swapping. In the analysis, I have assumed the following:
- To swap, I have to first sell Tower and then invest in the other REIT. This would incur a 1% cost for brokerage and stamp duty. For example, selling off Tower at the current price of RM 0.47 per unit for AmFirst would result in an investment of RM 62,816. At RM 0.37 per unit AmFirst market price, I would have 169,722 units of AmFirst.
- The amount of capital gain and dividends for the swap REIT would depend on the projected market price. I took the price in 8 years as the reference. I used the Dec 2014 price to represent this price assuming that the market would retrace the same price pattern. The 8 years dividends were assumed to be those from 2015 to 2022.
- The total gain for the swap REIT would be the capital gain plus dividend less that loss from the sale of Tower. In the case of AmFirst, this came to RM 29,127.
The analysis in Table 8 assumed that the office and retail sectors recover in 8 years. If I assumed that the office sector was slower to recover, I would have the situation as shown in Table 9. The recommendation is to then swap with Hektar.
Sector outlook
One of the factors to consider in whether to swap is the prospects of the office and retail sectors. My take here is that there does not seem to be much difference between these 2 sectors.
- The office sector will have a more challenging recovery given that the over-supply started even before the Covid-19 pandemic.
- The retail sector was soft even before the pandemic. But the opening of the economy will have a more positive impact here compared to the office sector.
My rationales for the above were based on the sector prospects as provided in the REITs’ Annual Reports. I present the key abstracts below.
Office sector
Source: Tower 2022 Annual Report
“…The purpose-built office (“PBO”) space sub-segment remains under pressure as a result of increased supply and lower demand…
The total supply of PBO space in the country increased… in 2021, which led to a decline in occupancy rates... Privately owned PBOs recorded an even lower occupancy rate...
Despite the lower occupancy rates, rental rates in key urban centers of the Klang Valley remained stable with the rental index in 2021 softening marginally by only 0.1% ...
…the prevalent oversupply of office space particularly in the Klang Valley will invariably impact demand. As a result, rental rates in the office sector may remain subdued in the immediate to medium term.”
“The office market is expected to remain subdued due to demand lagging behind supply…Similar to the occupancy trend, the average rental rate of prime office space in KL City (Prime A+ and Grade A) was lower on the year…
Source: AmFirst 2022 Annual Report
In the near term, the rental rates and occupancy levels of office buildings in Malaysia, especially in Klang Valley…will continue to experience downward pressure…As for KL Fringe, its occupancy level appears to be stabilizing…Meanwhile, the Selangor office market is expected to remain relatively resilient in the medium to the longer term...”
 |
| Chart 9: KL Rental |
Retail sector
Source: Hektar 2021 Annual Report
“…retail sales declined by 27.8% from a year earlier in 3Q21 while cumulative nine-month retail sales contracted 11.9% compared to the same period in 2020, as reported by Retail Group Malaysia (RGM). RGM had projected a full-year retail industry sales growth forecast of 0.5% for 2021.
According to RGM, Malaysia’s retail industry will continue to record positive growth as the retail and hospitality segments are the prime beneficiaries of this economic recovery.”
 |
| Chart 10: Retail Sales Growth |
Source: AmFirst 2022 Annual Report
“…vacancies in malls have more or less stagnated within the same five-year period, but the additions of new and often bigger complexes have dragged the occupancy rate down…The recovery of the retail sector is expected to be gradual given cautious consumer sentiments.
In the short to mid-term, the rental and occupancy levels in the retail market are expected to experience pressure following the adverse impact of the COVID-19 pandemic coupled with weaker demand amid the incoming supply of retail space.
Besides accelerating the shift towards e-commerce, digital payments including the Buy Now, Pay Later (BNPL) services have gained traction amid the pandemic. Driven by changing consumer behavior, retailers and stakeholders are expected to continue to enhance their omnichannel strategies to provide consumers with a seamless shopping experience, in which physical and digital platforms not only co-exist but complement one another.”
Conclusion
The analyses show that if you believe the office sector would have a slower recovery compared to retail, it would be better to swap Tower. I believe both the KL office and the retail sectors would have the same rate of recovery. I am better off not swap.
The other concern with swapping is that both AmFirst and Hektar will issue new capital to fund growth. This issuance would most likely value dilutive to the existing unitholders.
From a net gain and value dilutive perspective, I chose not to swap Tower with either AmFirst or Hektar.
End
- - - - - - - - - - - - - - - - - - - - - - - - - - - - - - - - -
How to be an Authoritative Source, Share This Post
|
Disclaimer & Disclosure
I am not an investment adviser, security analyst, or stockbroker. The contents are meant for educational purposes and should not be taken as any recommendation to purchase or dispose of shares in the featured companies. Investments or strategies mentioned on this website may not be suitable for you and you should have your own independent decision regarding them.
The opinions expressed here are based on information I consider reliable but I do not warrant its completeness or accuracy and should not be relied on as such.
I may have equity interests in some of the companies featured.
This blog is reader-supported. When you buy through links in the post, the blog will earn a small commission. The payment comes from the retailer and not from you.



Comments
Post a Comment