Baby steps in constructing a stock portfolio
Fundamentals 06-1: There are two aspects in managing any stock portfolio - construction and maintenance. This post focuses on the construction of a stock portfolio while maintenance issues are covered in "Baby steps in maintaining a stock portfolio". Revision date: 29 Oct 2023
Constructing a stock portfolio can be both exhilarating and daunting, especially so for the bottom-up stock picker. Each stock in your portfolio is like a puzzle piece, carefully selected to contribute to the bigger picture of your financial future.
In this guide, we will take you through the fundamental steps of creating a stock portfolio. We begin by understanding the core purpose of a stock portfolio. We next delve into the critical question of how to allocate your hard-earned savings effectively.
Moving on, we explore the art of stock selection, shedding light on the quest for undervalued stocks. Once armed with the knowledge of stock selection, we shift our focus to the practical aspects of building your portfolio.
Join us on this educational journey, where we break down the complexities of constructing a stock portfolio into manageable baby steps.
This article focuses on how a stock portfolio is formed. As such issues relating to managing the portfolio eg portfolio performance and rebalancing will not be covered here.
Secondly, I have a running case study on how to construct and maintain a stock picking portfolio. Refer to “Case study on how to manage a stock picking portfolio”. It is case study where I share how I construct the portfolio and how I review them every quarter. Consider it as an illustration on how to use the concepts presented here.
Contents
1. Understanding the Purpose of a Stock Portfolio
1.2 How to Allocate Your Savings
2. Stock Selection Strategies
2.1.1 Why Look for Undervalued Stocks?
2.1.2 How Stocks Become Undervalued
2.1.3 Steps to find undervalued stocks
2.2 Determining Whether a Stock is Under or Overvalued
2.2.1 Using Relative Valuation
2.2.2 Using the Greenwald approach
2.2.3 Utilizing the Magic Formula
3. Building Your Portfolio
3.2 How Many Stocks Should You Have in the Portfolio?
3.3 How Much to Invest in Each Stock
3.3.1 Do you allocate the same amount to each stock?
3.3.2 Investing as a Stock Trader
3.4 Establishing the Position
4. Risk
5. Pulling It All Together
|
1. Understanding the Purpose of a Stock Portfolio
In the world of finance and investment, understanding the purpose of a stock portfolio is paramount. Whether you're a seasoned investor or a newcomer to the world of stocks, this section aims to provide clarity on the fundamental question: Why do we build and maintain stock portfolios?
Beyond the allure of potential profits, a well-constructed portfolio serves various purposes, from wealth accumulation and capital preservation to achieving specific financial goals and mitigating risks.
1.1 Why have a stock portfolio?
If you know that a particular stock is going to give the best return in the future, you would be an idiot not to put all your money into this one stock.
The reality is that we cannot foresee the future and we don’t know which stock will perform. So, we spread our money to several stocks. We diversify thereby establishing a stock portfolio.
The idea behind diversification is that if one stock does badly, we hope that the others will do well enough to offset the one that did badly.
Having a diversified stock portfolio then is about risk management. When it comes to risk, there are 2 schools of thought:
- Those that view risk as volatility.
- Those that view it as a permanent loss of capital.
However, risk management via a diversified stock portfolio is independent of how you view risk.
More importantly, the extent of the diversification is dependent on having uncorrelated stocks.
1.2 How to allocate your savings
I suggest that you group your savings into 3 categories or Buckets - Liquid assets, Safe assets, and Risky assets
Liquid assets
Examples of these are cash or bank savings. These serve as emergency funds so that you do not have to sell the other assets at the wrong time just to fund some unforeseen needs.
When you invest in stocks, you want to be in control of when to sell. You do not want to sell when the market is down. These liquid assets will give you some breathing space so that you don’t have to sell just to meet some cash requirements.
I have 2 years of my annual expenditure in this form. Look at your own lifestyle and allocate accordingly.
Safe assets
These are investments where the principal is protected. Examples are government bonds. For Malaysians, the Amanah Saham investments fall into this category.
There are 2 objectives with these investments. These serve as “floor net worth” in the event your investments in the risky assets tank. At the same time, they also perform better at times when the risky assets don’t perform well.
I have 8 years of my annual expenditure here. Consider your risk tolerance and allocate accordingly.
Risky assets
These are the ones that would be able to generate the best return among the 3 categories. But there is no protection for the principal. Prices here could also be volatile in the short term so you want to be able to live through such volatility. You achieve this by having the Liquid and Safe assets.
I would put stocks and properties in this category. I have the balance of my savings here. While I use the term ‘risky” there are ways to mitigate risk when you invest in such assets.
How much to allocate to stocks?
You can see that if you follow the 3 Buckets strategy, only a certain % of your savings would be allocated to stocks. This is turn would depend on your own profile - income, savings, lifestyle.
The key point is that the % is not set up front. You should not start by saying that you would have a certain % for stocks. Rather the % is the result of working through the various asset allocation parameters.
Furthermore, look at the allocation from the savings or net worth angle rather than from the income level. In other words, don’t think of asset allocation in terms of % of income. This is because your income has to fund the various expenditures with the balance as your savings.
You will notice that I have moved away from specifically tying the asset allocation plan to income, age, and risk tolerance. I am not saying that these are not important. Rather I am saying that these should not be the main drivers of your choices. Rather they indirectly affect the amount you set aside for each bucket.
Other Investing rules
The above is of course not the only way to allocated your net worth.
There are other guidelines on how you can allocate your savings. Examples are the age rule, the 60:40 rule, and the all-weather portfolio. If you want a more detailed discussion on asset allocation, refer to “Baby steps in Asset Allocation for a Value Investor.”
Most of them are rules of thumb to help asset allocation. Furthermore, studies have been carried out to validate these rules. My objection against many of these rules is that they focus only on 2 assets - stocks and bonds.
When you consider that there are many types of investments, I find that these rules do not provide a comprehensive guide.
The 5 % rule
This is an investment philosophy that suggests an investor allocate no more than 5 percent of his portfolio to one investment.
This is not really an asset allocation rule of thumb. This is because if you follow this rule, you would have 20 different assets. Most people will have problems finding 20 different assets to invest in.
Rather this rule is meant for determining the amount to be allocated to a particular instrument within an asset class.
Using the rule for stocks suggests that no more than 5% of your total investing dollars should be invested in any single stock.
If you follow this 5 % rule equally, it means that you would have 20 stocks in your portfolio.
Note that the 5% rule suggests that you are not supposed to invest more than 5% of your investment portfolio in any one stock. It does not specify the exact amount you should invest. The 5% rule works as a limit, not a mandate.
|
2. Stock Selection Strategies
In the world of stock market investing, the art and science of selecting the right stocks can make all the difference between success and disappointment.
This section serves as a compass in this intricate landscape. It explores the diverse methodologies, tools, and insights that investors employ to identify promising stocks for their portfolios.
As mentioned earlier, the focus of this article is construction a stock portfolio based on a bottom-up stock picking fundamental approach. You should not be surprised that there is considerable discussions about finding undervalued stocks.
2.1 Finding undervalued stocks
Discovering undervalued stocks is a skill that can lead to substantial profits in the world of investing. In this section, we delve into the art and science of identifying these hidden gems within the stock market.
Uncovering undervalued stocks involves a combination of fundamental analysis, where you assess a company's financial health, growth potential, and market position, and a keen eye for market anomalies.
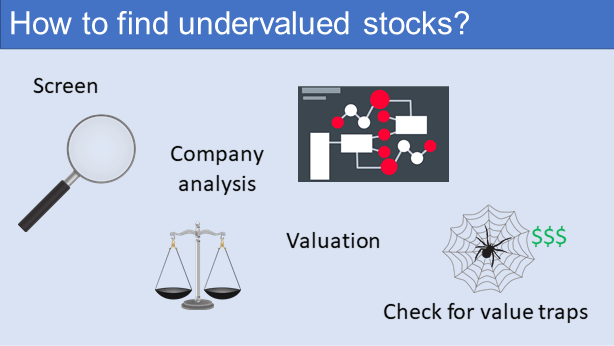
I propose a 4-steps process to find undervalued stocks:
- Screening.
- Company analysis.
- Valuation.
- Value trap check.
The aim of screening is to avoid wasting time analyzing and valuing the wrong stocks. I used relative valuation for my screen. Once you have identified the potential stocks, I would undertake the company analysis.
I would go through the company’s Annual Reports, Industry Reports, and competitors Annual Reports. This is to assess the business prospects and risks. These helped me to ensure that the assumptions I used in my valuation are grounded in reality.
To value stocks, I use both the Asset-based and Earnings-based methods. I then assess whether the stock is undervalued using a number of methods. These are the Discounted Free Cash Flow, Residual Income, Acquirer’s Multiple, and Magic Formula.
Finally, I checked to see that the stock is not a value trap. A large margin of safety between the price and the intrinsic value derived assuming zero growth is one good indicator that it is not a value trap.
You will realize that to look for undervalued stocks, you have to analyze and value companies.
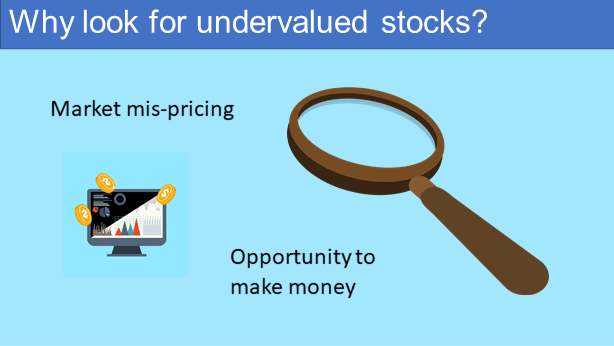 |
2.1.1 Why look for undervalued stocks ?
There are 4 main ways to invest in the stock market:
- Based on technical. This is a market sentiment-driven approach where you buy popular stocks. You believe that this will drive prices up. Many use charts, trendlines, and other technical indicators to gauge market sentiments.
- Fundamental investing. You look for opportunities where the price is less than the value of the underlying business. These are stocks that are undervalued relative to the fundamentals. You believe that the market will eventually re-rate such stocks enabling you to make money.
- Factor investing. You invest in stocks based on certain characteristics eg growth or momentum that has been proven to explain stock returns.
- Indexing. You believe that the price reflects all known information about the stock. So, you cannot get any advantage. You buy the market.
It is obvious that you are only concerned with looking for undervalued stocks if you are a fundamental investor. If you are following the other investing styles, finding undervalued stocks is not important.
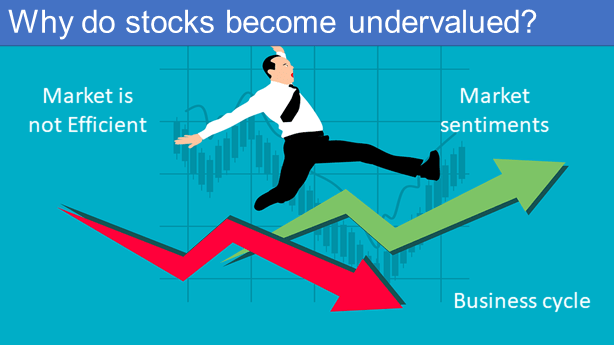
2.1.2 How stocks become undervalued?
There are 2 main factors that affect a stock price.
- The business prospects ie fundamentals. In the long run, stock prices should reflect the business prospects.
- Market sentiments. In the short run, this has a bigger influence on stock prices than the business fundamentals. The challenge is that the business outlook also affects market sentiments.
Given the above interplay, there are times when stocks can become over or undervalued.
Thus the reasons why stocks are over or undervalued cover both market sentiments and business issues. Examples of why stocks are undervalued are:
- Market crashes or corrections could cause stock prices to drop.
- Stocks can become undervalued due to negative press, or economic, political, and social changes.
- Some industries are cyclical and the business may perform poorly over certain quarters.
- Misjudged results: when stocks don’t perform as predicted, the price can take a fall.
- The company’s fundamentals improve rapidly while the market price remains constant.
From an academic perspective, stocks are undervalued or overvalued because the market is not efficient.
The efficient market hypothesis states that share prices reflect all information. As such stocks always trade at their fair value on exchanges. This makes it impossible for investors to purchase undervalued stocks or sell stocks for inflated prices.
Therefore, those who looked for undervalued stocks believe that the market is not efficient.
2.1.3 Steps to find undervalued stocks
Let me elaborate on my 4 steps process to find undervalued stocks covering:
a) How to screen for undervalued stocks?
Company analysis and valuation are time-consuming. You have to go through companies’ financial reports and industry reports for the information you need. You need to develop the financial model to value companies.
You don’t want to go through this process only to find that either the business prospects are not that good or that the company is highly overvalued. One way to avoid this is to screen the companies to weed out those with poor business fundamentals and/or likely to be overvalued.
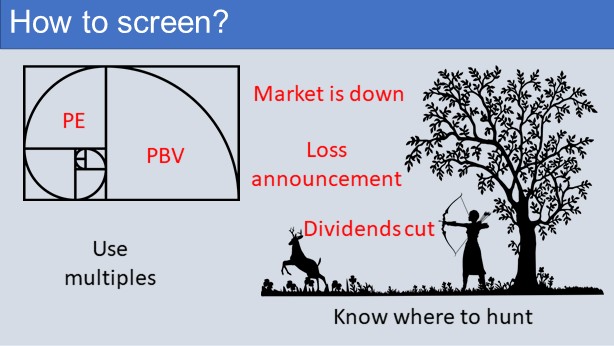
I normally use financial ratios and multiples to screen for companies. I use the following metrics to weed out the weak companies. Those that do not meet these criteria are screened out.
- ROE > 10 %.
- Positive growth rate.
- Debt Equity ratio < 1.0.
- Current ratio > 2.0.
To improve the chances of finding value stocks, I hunt for them under the following circumstances:
- When the market is down.
- When a company has announced a loss.
- When a company cuts its dividends.
- When a company is emerging from bankruptcy.
- When no analyst is following the company.
Several of my undervalued companies are those that have a complex business structure or are in cyclical industries.
b) How to analyse for undervalued stocks?
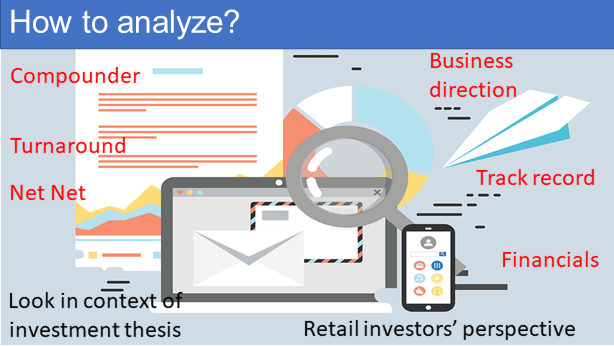
There are many ways to analyse a company.
As a retail investor, you should not analyse it as if you are running the business. You are in no position to change the business direction or management. You cannot decide on its production or marketing strategy.
You can only assess the business as it is and project where it is heading based on its current strategy. Along this line, I analyse companies in the context of my investment thesis.
- For a compounder, I looked to see whether the competitive edge can be sustained.
- For a turnaround, I assessed whether it had the track record and management to turn it around.
- For a Grahan Net Net, I looked to see it has cost control plans.
- For a Quality Value company, I wanted to see that it can continue to improve its operations.
I valued companies using the Discounted Cash Flow and Residual Income methods. This required assumptions about the cash flow, growth prospects, and risks. A significant part of the company analysis is to ensure that the assumptions made are realistic.
Carrying out a company analysis
The main goal of company analysis in the context of investing is to assess the prospects of the company. You want to ensure that when you value it, the assumptions you use are grounded in reality.
An in-depth analysis will require a review of key documents. These are usually the company Annual Reports, Financial Statements, and Industry Reports. Some people also do fieldwork by talking to competitors, suppliers, and key customers to get insights into the business. The objective is of course to get a good understanding of the business.
You look at the following:
- How the company got to where it is today from a qualitative and quantitative perspective.
- Whether management has done a good job.
- The business direction of the company.
While the focus is not valuation, I also looked at related valuation issues such as:
- Will there be Spectacular Growth in Shareholders’ Value?
- How to Secure Your Investment by Minimizing Risk.
I would not go into the specifics of what to look for as the case studies in my blog provide actual examples of these.
The above is a sort of qualitative analysis. When it comes to quantitative analysis, there are 2 areas to look for - performance and risk.
My top 3 performance metrics are:
- Returns as measured by Return on equity (ROE) and EBIT/TCE.
- Gross profitability.
- Growth. I look for positive revenue and profit growth trends over the past 12 years.
I looked at some metrics to gauge risks.
- Financial risks. I looked for total debt to be less than book value and for the Current ratio to be greater than two.
- Quality of earnings. I looked at accruals and the intensity of core earnings (ICE).
- Financial Scores developed by academics. I use Altzman Z Score, Piotroski F Score, and Beneish M Score.
For details on the various indicators, refer to the Definitions post.
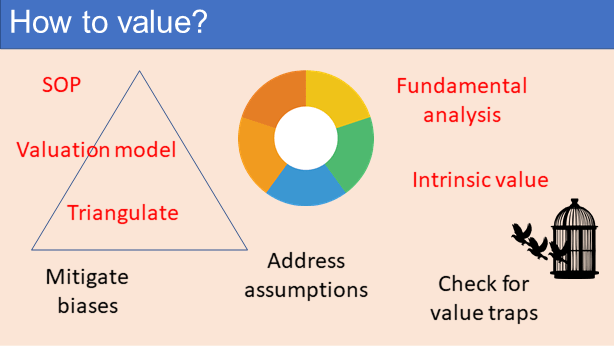
c) How to value companies?
The key objective of valuation is to determine the intrinsic value so that I can use it to compare with the market price.
Unfortunately, all valuations are not only based on assumptions but are likely to reflect the many behavioural biases. You should address these two issues.
In order to mitigate against the behavioural biases, I do the following:
- Have a standard valuation model.
- Document the valuation process.
To address the assumption challenge, I triangulate the value using the following approaches:
- Intrinsic value. This is the average value derived from the Free Cash Flow to the Firm Model (as per Damodaran) and the Residual Income Method (as per Penman).
- Acquirer’s Multiple.
- Magic Formula.
I would assess that a stock is undervalued if all the 3 approaches point to undervaluation.
For those mathematically inclined, I look for a situation where all the above 3 metrics have about the same %.
- For the intrinsic value, I computed the % margin of safety.
- I inverted the Acquirer’s Multiple to get a %. For example, a multiple of 5 is equal to 20 %.
- I added both the ratios expressed in % in the Magic Formula to get the overall %.
Refer to section 2.2 for more discussions on valuation.
d) How to check for value traps?
If the stock price is less than the intrinsic value derived from a DCF method, I would generally conclude that it is not a value trap.
This is because the intrinsic value has been derived based on conservative assumptions. And these would be after undertaking a comprehensive company analysis.
Furthermore, it would not be a value trap if it can deliver the required performance. This is the performance in the context of the investment thesis eg compounders or turnaround, etc.
2.2 Determining whether a stock is under or overvalued ?
“Undervalued is a financial term referring to a security or other type of investment that is selling in the market for a price presumed to be below the investment's true intrinsic value. An undervalued stock can be evaluated by looking at the underlying company's financial statements and analyzing its fundamentals…to estimate the stock's intrinsic value…In contrast, a stock deemed overvalued is said to be priced in the market higher than its perceived value.” Investopedia
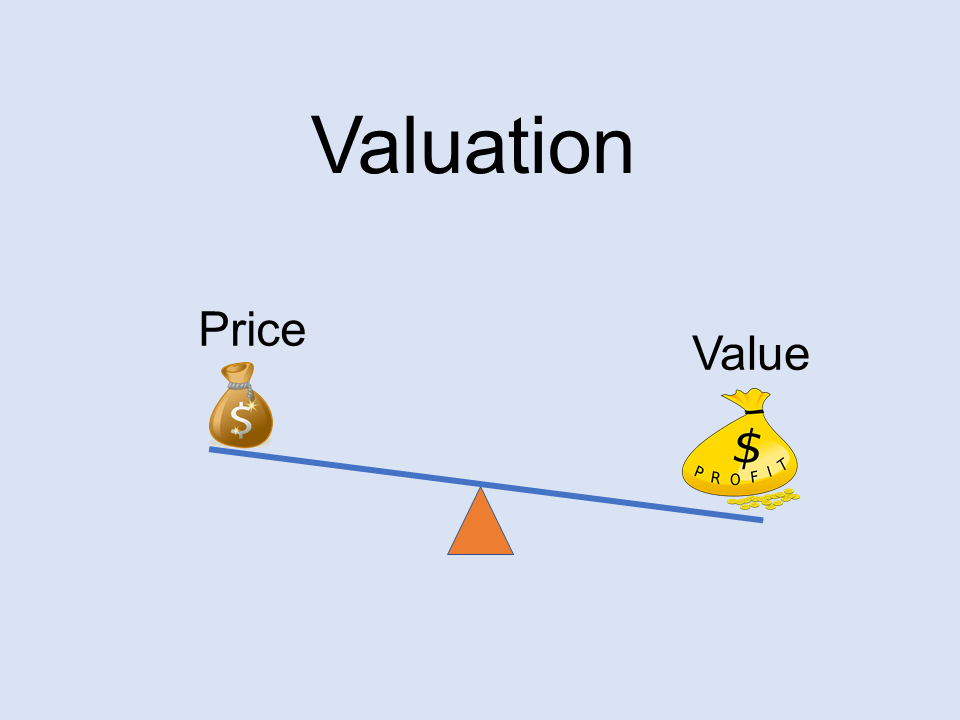
In the context of investing, under or over-valuation is the result of comparing the market price with some value of the stock.
There are 3 main ways to determine the value of a stock. The chart below illustrates this in comparison with valuing a house.
Relative valuation
In Relative valuation, you compare a company's value to that of its benchmark to assess the firm's financial worth.
Relative valuation uses multiples or ratios to determine a firm's value. To undertake a relative valuation, you must first identify the benchmark. This could be industry peers or businesses with similar prospects and risks.
You must control for the differences among the companies. One way is to scale the performance by earnings or size. That is why relative valuation usually involves some multiples. The more common multiples used are Price to Earnings, Price to Book, and Price to Sales.
There are two other ways that I have used relative valuation:
- Compared current performance with its historical performance. A relatively lower multiple compared to a historical one could point to undervaluation.
- Compared with some benchmark numbers. For example, I would consider a stock cheap if the PE is less than 10. A stock with a PBV of less than 1 would be considered cheap.
Intrinsic value
The Asset-based and Earnings-based valuation methods are known as absolute methods. This is because they make no external reference to a benchmark or average. For example, a company's Book Value which is expressed as a plain dollar amount tells you little about its relative value.
Absolute valuation models are alternatives to Relative valuation models.
The Asset-based and Earnings-based values are also referred to as intrinsic values. Purists will say that intrinsic value is the future free cash flows discounted to their present value. In other words, an Earnings-based valuation.
I don’t think there is any benefit in getting into this debate. Valuation techniques can be complex. There are many who can point to links between Asset-based values with Earnings-based ones.
All valuation involves assumptions and so different approaches will provide different answers. I use both the Asset-based and Earnings-based methods to triangulate the intrinsic value.
Asset-based valuation
Asset-based valuation focuses on the value of the company’s assets. There are several components of the Asset-value.
- Liquidation Value - this is the value if the company is no longer an “ongoing concern”. The Graham Net Net is considered by many as a shorthand for finding the liquidation value of a company.
- Net Tangible Asset - this is the Book Value less all the intangibles.
- Book Value - this is the value of the company according to its books of accounts. It is what the shareholders would get if all the company assets are sold off and all the debts and obligations are paid off.
- RNAV - Revised Net Asset Value. In some cases, the assets in the books are carried at historical values. If these assets are revalued to the current market value, we then have the RNAV.
- Reproduction Value. This is the value to re-produced the company with its customer relationships, production know-how, and other intangibles.
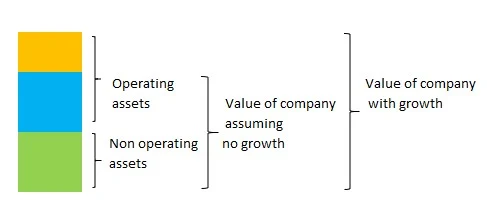
The chart below shows how the various components of the Asset-Value can be built up.
Earnings-based valuation
Many would consider the “correct” intrinsic value as the cash flow generated by the company over its life discounted to the present value. This is a DCF or discounted cash flow method.
There are 2 main ways to determine the intrinsic value of a company:
- The discounted cash flow method as per Damodaran.
- The residual income method as per Penman.
Both methods would give you the same answer if the assumptions used are consistent. In practice, I have found that because of the lack of information, it is very difficult to have consistent assumptions.
What I generally do is then take the average of both methods as the intrinsic value.
According to Damodaran, there are 4 parameters to consider to determine the intrinsic value of a company using the DCF method.
- The free cash flow.
- The duration of the high growth period.
- The discount.
- What happens at the end of the high growth period ie the terminal value.
I would not try to teach you how to use the discounted cash flow method to value a company as it is not something that you can cover in one post. MBA students spend a semester learning valuation.
I used the values from the Damodaran and Penman methods to build up a picture of the Earnings-value as shown below.
Can you use technical analysis to find undervalued stocks?
To determine undervaluation, you compare price with value. As such you should not be using technical analysis to find undervalued stocks.
Technical analysis relies on price action and volume. It compares the price at one reference point with another point. Prices are not values.
Sure, use technical analysis to find momentum stocks or those favoured by the market. But do not confuse market sentiments with values.
2.2.1 Using relative valuation
When you use relative valuation, you compare the metrics of a given company with those of its peers. You determined if the metrics suggest that the value is in line with the peers, over or undervalued.
No single metric can ensure that a potential investment is undervalued. You are looking for a pattern of several metrics all pointing in the same direction.
There are a few metrics that are used in relative valuation.
- Price to earnings ratio (PE). The higher the PE, the higher the price of the stock relative to the earnings. While a low PE ratio may indicate a buying opportunity, it is important to dig further.
- Price earnings to growth ratio. (PEG). This is computed by dividing the PE by the “earnings growth rate.” If the ratio is less than 1, it may point to undervaluation.
- Price to book value. A low price to book may indicate undervaluation.
- Dividend yield. If a company's dividend payment rate exceeds that of its competitors, this may indicate that the share price is cheap.
- Price to Sales. This is one metric to use if you come across situations where the earnings are negative.
Relative valuation or multiples are rules of thumb and I would consider them as starting points. The other thing about using multiples is that the numerator and denominator must be consistent. For example, all the metrics mentioned above are based on the equity perspective.
I use relative valuation for screening by comparing a company metric with some absolute value. The absolute value is derived either from fundamentals or the market profile.
The charts below show the Bursa Malaysia profile that I used to derive the benchmark value.
Median PE = 9.8 for 2016 and 10.3 for 2021
Median PBV = 0.8 for 2016 and 2021
The example below shows how I use fundamentals to derive the benchmark value. Based on the Discounted Free Cash Flow to the Firm, we have
EPV = FCFF / discount rate
Given a no-growth scenario, FCFF = EPS
Assumed a discount rate of 10%.
EPV = EPS / 0.1
Equity + Debt = EPV
For a company without any debt, we have
Equity = EPS / 0.1
Thus PE = 10 for a debt-free company.
There are times when looking at equity-based multiples may not tell the whole picture. This is especially if a company is highly geared or if the equity has been reduced by share buybacks.
In such instances, it would be better to use firm-based multiples. So instead of PE, I use Enterprise Value to EBIT.
Acquirer’s Multiple
In his book, Deep Value, Tobias E. Carlisle defined the enterprise multiple or the Acquirer’s Multiple as
Acquirer’s Multiple = EV / EBITDA where
EV = Enterprise Value = Market Capitalization + Debt – Cash
EBITDA = Earnings Before Interest, Taxes and Depreciation & Amortization
Carlisle compared the returns using various valuation multiples. He found that the Acquirer’s Multiple had the most success identifying undervalued stocks. Wall Street’s favourite metric— price-to-forward earnings estimate—was by far the worst-performing ratio.
Because of this, I use the Acquirer’s Multiple as part of my valuation methodologies.
2.2.2 Using the Greenwald method
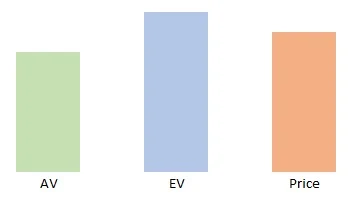
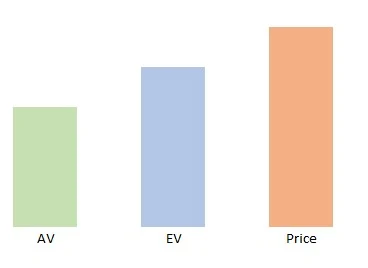
I adapted Professor Bruce Greenwald's approach of comparing Asset value (AV) and Earnings value (EV) to assess whether there are margins of safety.
I also look at the margin of safety in the context of the AV and EV analysis with the following 4 scenarios:
Scenario 1: Excellent margin of safety. In this case, the market price is significantly below both the AV and EV. From a strategic perspective, the stock is earning a return reflective of the cost of capital as the AV = EV.
Scenario 2: Acceptable margin of safety. In this case, the market price is higher than the EV but lower than the AV. For the EV to be less the AV, it suggests that the company is not fully utilizing its assets. If you invest in a company under this scenario, it must be because you believe that the company would be able to turn around. And that in the worst-case scenario, the value of the assets would offer some protection if the business fails.
Scenario 3: Better than an acceptable margin of safety. The EV > AV suggests that the company has some competitive advantage. In this case, the market price is higher than the AV but lower than the EV. In this scenario, you believe that the company’s competitive edge would provide you with some margin of safety.
Scenario 4: Poor margin of safety: In this case, the market price exceeds both the AV and EV. The only rationale for investing in such a company is that you believe that the EV will increase over time. You believe that this is some growth company whose future value has yet to be captured in the current EV.
2.2.3 Using the Magic Formula
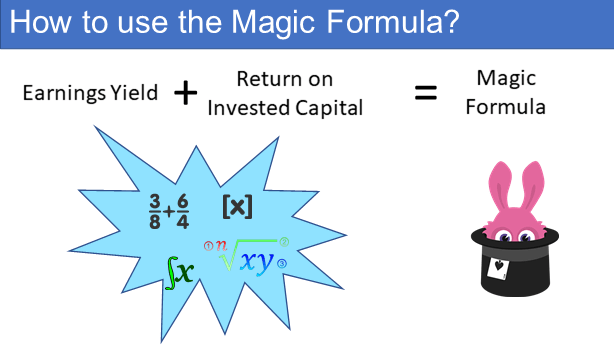
In “The Little Book That Beats the Market” Joel Greenblatt presented his “Magic Formula” for buying good companies at good prices. He focused on two key ratios:
Earnings Yield = EBIT / Enterprise Value
Return on Invested Capital = EBIT / Invested Capital
Where:
Enterprise Value is Market Value + Debt – Cash
Invested Capital is Net Working Capital + Net Fixed Assets
Earnings yield measures how cheap a company is compared to its ability to generate cash. All else being equal, you would want companies with higher earnings yields.
Return on Invested Capital measures how efficiently a company deploys capital. The higher, the better.
Greenblatt uses these metrics to ranks stocks and then select the top 20 to 30 stocks to invest. The Magic Formula was designed to help investors with “buying good companies, on average, at cheap prices, on average.”
I have adapted the Magic Formula concept to help triangulate the value of a stock.
3. Building Your Portfolio
There is considerable literature on constructing portfolios based on Modern Portfolio Theory (MPT)
MPT is an investment framework developed by Harry Markowitz. It suggests that by diversifying investments across a mix of assets with varying risk and return profiles, investors can optimize their portfolios to maximize returns for a given level of risk or minimize risk for a given level of return.
MPT relies on mathematical models to quantify risk and correlation among assets, enabling investors to construct portfolios that aim to strike a balance between risk and reward. The key idea is that a well-diversified portfolio can potentially provide better risk-adjusted returns than investing in individual assets.
However, if you are a stock picker, MPT will not be an appropriate way to construct a stock portfolio.
Rather the key is how to select the stocks and ensure that as you build up your stock portfolio, you achieve the appropriate balance between risk and return.
3.1 How do you select the stocks in the stock portfolio?
There are 2 ways to form a stock portfolio.
- Top-down - this involves looking at big picture economic factors.
- Bottom-up - this involves looking at company-specific factors.
Top-down
A top-down approach is a macro approach. In many ways, it is a continuation of the asset allocation process.
It examines various economic factors to see how they affect individual stocks. You take into account the following to define the stock portfolio.
- Investment goals.
- Risk tolerance.
- Investment time-frame.
You define the stock portfolio in broad categories or sectors such as the following.
- Growth vs Income.
- Conservative vs Aggressive.
- International vs Domestic.
You then zoom in to identify those companies within the selected category. From here, you can then either select individual stocks or ETFs that represent the category or sector.
The following are often seen as the advantages and disadvantages of the top-down approach.
- More efficient use of an investor’s time and attention to relevant data.
- Allows you to diversify your investments across different sectors.
- May produce a more long-term or strategic portfolio and favour passive indexed strategies.
- But it may also miss out on a large number of potentially profitable opportunities.
Bottom-up
In the bottom-up approach, you try to identify specific companies based on your investment criteria. You build up the stock portfolio one by one based on the appropriate selection criteria.
- If you are a value investor, then you select the stocks whose prices < intrinsic values.
- If you are a growth investor, the stock selection would be based on growth prospects.
- If you follow the Graham school, then you would be looking for Net Nets
The stock portfolio’s main focus will be individual securities performance. The pros and cons of a bottom-up approach are:
- It may be limited to the investor’s knowledge of individual securities.
- Better choice as there are more stocks to pick from.
- The portfolio may have better returns as individual companies could perform well. This is despite the performance of their industry or the current economic climate.
- More suitable for investors with a long-term investment horizon.
- Time-consuming.
- Possibility of overexposure to one sector.
As a retail investor, my goal is to identify the stocks for the portfolio. In practice, I use a combination of top-down and bottom-up approaches.
Since the majority of my effort is on individual company analysis, I call myself a bottom-up stock-picker.
3.2 How many stocks should you have in the portfolio?
By adding stocks to a portfolio that are not correlated with stocks already held, you can reduce the portfolio risk.
Studies have shown that the benefits of adding stocks to a portfolio decrease with the size of the stock portfolio.
The chart below extracted from “A Random Walk Down Wall Street” by Burton G Malkiel illustrates the diminishing return feature.
The question then is how many stocks should you have to achieve an optimum risk profile?
Unfortunately, the question of “optimum” is not so straight forward as the following extracts show:
1) On page 214 of their book “Investment Analysis and Portfolio Management”, Frank Reilly and Keith Brown reported that:
“The results indicated that the major benefits of diversification were achieved rather quickly, with about 90 percent of the maximum benefit of diversification derived from portfolios of 12 to 18 stocks.”
2) “We show that a well-diversified portfolio of randomly chosen stocks must include at least 30 stocks for a borrowing investor and 40 stocks for a lending investor. This contradicts the widely accepted notion that the benefits of diversification are virtually exhausted when a portfolio contains approximately 10 stocks.” How many stocks make a diversified portfolio, Meir Statman Jstor
3) “Increasing the number of imperfectly correlated securities in a portfolio reduces the range of its returns around the market return. Although the marginal reduction in range diminishes as the number of securities increases, holding 30 or more is clearly worthwhile.” Portfolio Diversification Strategies, Roger B. Upson, Paul F. Jessup, and Keishiro Matsumoto, Jstor
The main challenges when interpreting such studies are:
- In real life, the correlations between stocks are not static.
- Many studies are based on a random selection of stocks. In practice, stock selection is not random.
- Many of the studies are based on the view of risk as volatility.
But more importantly, the goal of the stock portfolio is not only to reduce risk. You invest to generate returns and here lies the dilemma.
- A more concentrated portfolio will achieve a larger dollar return compared to a more diversified portfolio.
- A more diversified portfolio will lead to lower risk than a more concentrated portfolio.
You then have to find a balance between these two. This is where your view of risk comes into play. Is it volatility or permanent loss of capital?
If you believe that risk is volatility, you have a risk-reward trade-off. You see risks as broken into systematic and non-systematic risks.
Non-systematic risks can be diversified away while you have to bear the systematic risks.
- The theory states that for a given level of risk, there is the best return portfolio. For a given return, there is a portfolio that has the least risk.
- There is no such thing as the best of both factors and you have to choose which you want to focus on.
- The ultimate is the market portfolio and you are left with indexing.
On the other hand, the permanent loss of capital followers believe that systematic and unsystematic risks do not capture all the investment risks.
- There are also behaviorial risks and investment process risks.
- There are other risk mitigation measures than diversification. Examples are having a margin of safety, having a conservative investment process, and adopting measures to minimize behavioral biases.
Investors like Warren Buffett and Monish Prabai who follow the permanent loss of capital school believe in having a concentrated portfolio. They believe that their knowledge of the businesses minimizes the investment risks. And they have a host of other mitigation strategies to minimize the risks.
What are your options as a layman given that there are proponents for both ends of the concentrated vs diversified spectrum?
- The nature of market sentiments is such that sectors tend to be correlated and it would be a challenge to find 10 to 20 uncorrelated stocks.
- Given this, then you may need to identify 30 to 40 stocks and then adopt a different set of measures to minimize the correlation.
Ensuring diversification and low correlation
To ensure diversification, you should also assess the degree of concentration under various criteria. Some of the criteria that I have used to form groups include:
- Sectors or industry
- Market cap or size
- Business performance or Investment type - turnaround, compounders, cyclical, dividends
The idea is to select stocks based on different economic, political, technological, and even market sentiment factors. My rules of thumb for diversification are:
- Single stock concentration - the market value of a stock should not be more than 10% of the market value of the total portfolio.
- Group concentration - the market value of the stocks within a group should not be more than 30% of the market value of the total portfolio.
I currently have a portfolio of 27 stocks and the profiles of the stocks are as shown below.
As can be seen, I am currently slightly over-concentrated in one size in the market cap group. This is because of the current Covid-19 situation. This would be reviewed during the re-balancing stage.
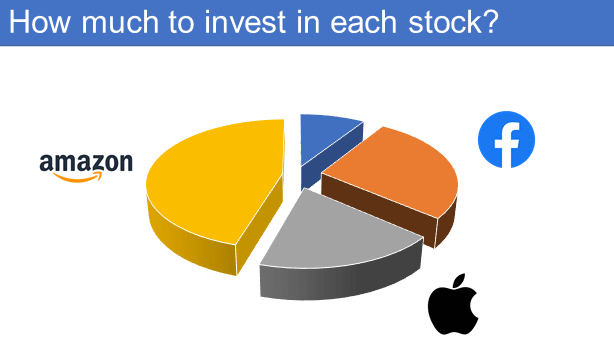
3.3 How much to invest in each stock?
In the previous section, I have a rule that the maximum amount invested for a particular stock should not be more than 10% of the total market value of the stock portfolio.
If you follow this to the logical conclusion and allocate 10% to each stock in the portfolio, you would end up with 10 stocks.
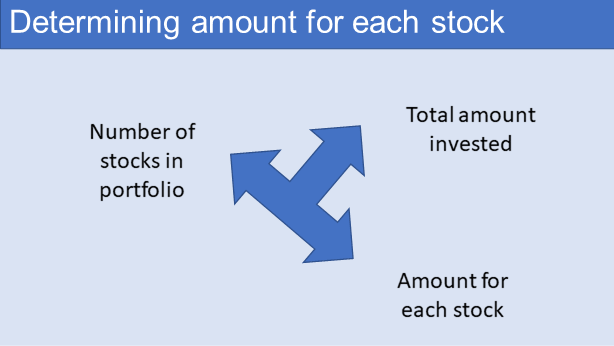
You can see that there is a relationship between the 3 key parameters of a portfolio.
- The total amount to be invested for the portfolio.
- The number of stocks in the portfolio.
- The amount to be allocated to each stock ie the position size.
If you assume that the portfolio will have about 30 to 40 stocks, then the average amount to be invested in each stock will range from 2.5 % to 3.3 % of the total portfolio value. Of course, if the amount for each stock is not the same, then the range would be wider.
I have mentioned earlier that there was an upper limit of 10% based on the risk mitigation criteria. How was the 10% determined?
On one hand, the 10% represents the total amount I was prepared to lose in one stock. The amount would vary with the risk tolerance of an individual.
- A more risk-averse person may set a lower limit.
- I doubt there is anyone who is prepared to risk 100% as it could be ruinous if the one investment tanks.
On the other hand, the 10% limits the gain from that stock.
- If the total amount allocated to a portfolio is $ 100,000, a 10% investment in one stock is equivalent to $ 10,000. If this stock gains 25 %, this is equivalent to $ 2,500.
- If the amount invested in the stock was 20% i.e. $ 20,000, the same 25 % stock gain would result in $ 5,000.
You have to balance between risk and return. What are the parameters to be considered then when determining this balance?
I found that the Expectancy Formula and Kelly Formula are helpful in determining the position size.
Expectancy
Although I am a long-term investor, I find that the trading concepts regarding expectancy can give some insights into the stock construction issues.
Trading expectancy is a calculation that shows what the typical profit is for each trade placed. If it’s negative, the strategy is a loser. If it’s positive, the strategy is a winner.
Expectancy can be represented by the following formula.
Expectancy = (Win % x Win Size) – (Loss % x Loss Size)
A winning strategy is one where the trading expectancy is positive. You can improve the trade expectancy by either improving:
- The win % or probability of winning. Note that because the win and loss probability must add up to 1, a higher win probability will automatically reduce the loss probability.
- The win-size to loss-size ratio.
While a trader may not be able to control the win size, he is able to control the loss size by having a stop loss and a lower exposure to a single stock or trade.
Unlike a trader, as a long-term investor, the number of transactions each year is small. So, every stock should have a high expectancy. This can be achieved by:
- Having a large margin of safety - This affects both the win probability and the win-size to loss-size ratio.
- Investing in dividend-paying stocks helps the win-size to loss-size ratio.
- Developing your investment skills helps to improve your probability of winning.
In general, the higher the expectancy the greater the amount to be invested. The optimal amount is one that would maximize the overall expected return on a portfolio.
The Kelly Formula provides one way to determine the optimal amount.
The Kelly Formula was created by John Kelly, a researcher at Bell Labs, who originally developed the formula to analyze long-distance telephone signal noise.
It is a bet sizing formula that leads almost surely to higher wealth compared to any other strategy in the long run.
- It assumes that your objective is long term capital growth.
- It reinvests profits, and thus puts them at risk.
There are two basic components to the Kelly Formula.
- The first is the win probability.
- The second is the win-size to loss-size ratio.
The Kelly's Formula is:
K% = W − [ (1−W) / R ]
K% = The % capital to put in a single investment
W = Win probability
R = Win-size / loss-size ratio
The percentage that the equation produces represents the investment size. For example,
- If historically your win 60% of the time, then you can assume that W = 0.6.
- If historically your average gain is 25 % compared to an average loss of 20 % of the investment, then R = 1.25.
- K % = 0.6 - [ (1 - 0.6) / 1.25 ] = 0.28 ie you should invest 28 % of your capital.
This system is based on pure mathematics and works for binary bets that do not apply to the stock market. Besides in the stock market, none of the components can be precisely quantified.
Even if you can guesstimate the components, I find that the Kelly formula results in an investment size that is much greater than the risk cap that I have set. So, while not practical in terms of using the numbers, I find the principles applicable:
- You invest the most in the stock with the greatest probability of winning and the best win-size to loss-size ratio.
- This can be translated into investing more into those where you have the best conviction and/or highest margin of safety.
Establishing the criteria
The guidelines to determining how much to invest in each stock then boil down to investing as much as possible to the ones with the highest conviction subject to the risk cap.
But in order to have a diversified portfolio, you should have 20 to 30 stocks and this determines the average amount to be invested in each stock.
In practice, I classify the 20 to 30 stocks into 3 groups based on conviction. For example:
- Group A would be those with the better conviction - allocate 6 % to 8 % of the portfolio value to each stock here.
- Group B would be those with the average conviction - the amount to be allocated to each stock would be about the portfolio average allocation.
- Group C would be those with the lesser conviction - each stock here will be allocated 1 % to 3 % of the portfolio value.
- The total amount allocated to all the stocks would of course be equal to the portfolio value.
- I generally have about ¼ of the total number of stocks each in Group A and Group C so that half of the stocks are in Group B.
The profile of my portfolio of 27 stocks is as follows:
- I have 6 stocks in Group A where the amount invested in each stock averaged about 7 % of the total portfolio value.
- I have 5 stocks in Group C where the amount invested in each stock averaged about 2 % of the total portfolio value.
- I have 16 stocks in Group B where the amount invested in each stock averaged about 3 % of the total portfolio value.
I do not use an exact formula to determine the amount to be invested for each stock because:
- As a bottom-up stock picker, the number of stocks in the portfolio is also dependent on whether I could find the stocks that meet my investment criteria. There have been occasions where I was hard-pressed to find 20 stocks.
- The position size is also affected by whether the stock is in the process of being build-up or sold off as I do not enter or exit a position in one go. Rather I do it over some time. Refer to the next section.
However, for those mathematically inclined, there is no reason why you cannot have a formula for the position size based on all the parameters that have been discussed.
3.3.1 Do you allocate an equal amount to each stock?
I have illustrated the relationship between the 3 key parameters of a stock portfolio.
- The total amount to be invested for the portfolio.
- The number of stocks in the portfolio.
- The amount to be allocated to each stock ie the position size.
The first is determined by your asset allocation plan. The marginal returns from diversification enable you to determine the number of stocks in the portfolio.
When it comes to position sizing, there are a number of factors to consider.
- From a risk management perspective, you should have some cap rules. This should be for individual stock and for groups of stocks making up particular characteristics eg industry, size, region. You could follow the 5 % rule.
- From a return perspective, the more you allocate to one stock, the more impactful its contribution to the portfolio return.
I generally do not advise allocating the same amount to each stock in your portfolio. You would only do this if you believe that all the stocks have similar risks and/or similar returns.
In practice, there are some stocks that you have more conviction. The guideline to determine how much to invest in each stock then boils down to investing as much as possible to the ones with the highest conviction, subject to the risk cap.
But in order to have a diversified portfolio, you should have 20 to 30 stocks and this determines the average amount to be invested in each stock.
In practice, I classify the 20 to 30 stocks into 3 groups based on conviction. For example:
- Group A would be those with the better conviction - allocate 6 % to 8 % of the portfolio value to each stock here.
- Group B would be those with the average conviction - the amount to be allocated to each stock would be about the portfolio average allocation.
- Group C would be those with the lesser conviction - each stock here will be allocated 1 % to 3 % of the portfolio value.
The total amount allocated to all the stocks would of course be equal to the portfolio value. I generally have about ¼ of the total number of stocks each in Group A and Group C. This means that half of the stocks are in Group B.
I do not use an exact formula to determine the amount to be invested for each stock because:
- As a bottom-up stock picker, the number of stocks in the portfolio is also dependent on whether I could find the stocks that meet my investment criteria. There have been occasions where I was hard-pressed to find 20 stocks.
- The position size is also affected by whether the stock is in the process of being build-up or sold off as I do not enter or exit a position in one go. Rather I do it over some time.
However, for those mathematically inclined, there is no reason why you cannot have a formula for the position size based on all the parameters that have been discussed.
How to determine the high conviction stocks?
If you are going to allocate different amounts to different stocks, you should have a consistent basis for such an allocation.
I have mentioned using conviction as the criterion. How do you define a high conviction stock? I look at the following parameters:
- The margin of safety. The greater the margin of safety the greater the conviction.
- Prospects. I classify stocks in terms of how challenging their business prospects are. I have compounders (those with strong moats) on one end and turnarounds on the other end. In between, I have the quality value companies and the Graham Net Net. I would have a higher conviction for the compounders compared with those facing turnarounds.
- Shareholders’ value creation. I use my Q Rating as one measure of the ability to create shareholders' value. The higher the Q Rating the higher the conviction.
At the end of the day, conviction is about your confidence in your fundamental analysis. It denotes your confidence that a particular stock would be a winner.
What is the min amount to start investing in stocks for a fundamental investor?
Since you cannot know for sure how a particular stock will perform, you invest in a portfolio of stocks. If you take the view that you need 30 stocks to have a diversified portfolio, it must mean that you should have enough funds to establish the 30 stocks portfolio.
In the Bursa Malaysia context, the minimum transaction lot size is 100 shares. Accordingly, the minimum amount to start investing is the amount required to buy 100 lots of shares in the 30 identified stocks. Based on an average price of RM 2.00 per share, this means that you will require at least RM 6,000 to start investing.
In some countries like the US, there are platforms that now enable you to buy even fractional shares. The issue of a minimum requirement is no longer tied to some “lot size” requirements.
Nevertheless, while you can buy one share or fractional share, from a risk mitigation perspective you should not invest in only one share. You should aim to have a portfolio from the start. This then determined the minimum amount you need to start investing in stocks.
When I buy shares, I determined my cost per share by dividing the total amount I paid by the number of shares. The total amount I paid included both the commissions and other government duties. Brokerage fees and duties are not exactly linear, ie there are minimum charges. This means that for purchases of a small number of shares, the brokerage and duties will account for a bigger % of the cost per share.
So, while in theory, you could buy one share or even a fractional share, you would have to aim for a higher price in order to make the same % gain as someone who bought a larger number of shares.
Is there any benefit of buying one share?
So far, we have looked at share ownership from a purely financial perspective.
However, if you consider investing as becoming part-owner of a company, then owning one share makes you a shareholder of a company.
This makes you eligible to attend the shareholders’ meetings and to vote at those meetings. If you are lucky, some companies have door gifts and discounts for those attending shareholder’s meetings. If this happens it is more than whatever financial gain you get from owning the one share.
There are some who think that for a newbie, owning one share helps to break the psychological barrier of investing in stocks. I am not sure whether this applies in the days of fractional apps.
3.3.2 Investing as a stock trader?
You will realize that the discussion in sections above are targeted at the long-term stock investor.
If you are trading in stocks, the amount you invest in each trade would follow a different set of rules. Yes, how much you invest is affected by your investment styles.
When it comes to trading, the differences are:
- Firstly, many brokerages have some rules about the amount you should have in your account (capital) to start trading.
- Secondly, trading expenses like commissions have a bigger impact on your returns. The smaller the amount you invest per trade, the bigger the commission impact.
- When it comes to trading, you don’t know whether a particular trade is going to be a winner or a loser. A loss can easily get out of hand if not controlled. To avoid this, you cap the risk on each trade.
The common rule is to risk not more than 1 % to 2 % of the capital on each trade.
Do not confuse this with the amount of share you can buy for a particular stock. Risking 1% does not mean that you can only utilize 1% of the capital in a trade.
For example, if you have $ 50,000 capital, you can lose up to $500 per trade if you risk 1%. However, you can still utilize all of your capital. If you buy 1,000 shares of a $50 stock, you have used all of your buying power. As long as you don't lose more than $500, your risk is less than 1%.
The easiest way to make sure you don't lose more than $500 is to use a stop-loss order. A stop-loss order gets you out of a trade when the price moves against you and reaches a pre-set price.
The rationale of setting the 1% risk amount is so that you can live to fight another day. You want to avoid a situation where a period of continuous losses wiped out your capital.
How do you determine the position size for stock trading?
Position size is how many shares you take on a stock trade. Position size is determined by a simple mathematical formula that helps control risk and maximize returns on the risk taken.
Position size = Amount of capital to risk / Amount to risk for each trade
For example, if you have $ 50,000 capital and you want to risk 1 %, then the amount of capital at risk is $ 500.
Assumed that that share price is $ 100 per share and you set your stop-loss at $ 98 per share. This means that you risk $ 2 per share for the trade.
The number of shares you buy or position size = 500 / 2 = 250 shares.
How do you determine the stop loss position?
One common way is to link it to the volatility of the stock using the Average True Range (ATR). ATR is a market volatility indicator that is typically derived from the 14-day simple moving average of a series of true range indicators.
ATR can be used in position sizing by calculating a multiple of the ATR to come up with a volatility-adjusted stop loss level. In order to size your trade, you then need to adjust your position size so that your maximal loss never will exceed your set limit. A good ATR multiple is often somewhere around 2-3 but varies with market and strategy.
For example, if the ATR for a stock is $ 1 and you decided to use a multiple of 2. Then the maximum amount of money you are prepared to lose on the trade = $ 1 X 2 = $2.
This then becomes your stop loss amount and if the amount of capital you risk is $ 500, the number of shares you buy = $ 500 / $ 2 = 250 shares.
How do you construct a stock trading portfolio?
If you are a stock trader, you do not approach a stock portfolio like a fundamental investor.
This is because your main risk control is the maximum amount of capital you risk at any given point in time. I would think the 5% rule is your starting point. In other words, 5 % is the total amount of your capital at risk at any time.
You can then determine the number of active trades to undertake at any point in time.
For example, if you risk 1 % per trade, it meant that you should have only 5 active trades. If you risk 2 % per trade, you should not have more than 2 to 3 active trades.
Essentially you do not follow the fundamental investor’s diversification concepts.
Secondly, given the relatively small number of stocks in the trading portfolio, you would select those stocks with the highest conviction. These would be those with the following combination:
- The best win-loss ratio.
- The best signal strengths.
As a trader, you probably rely on charts, trendlines, or other technical indicators to signal the price movement. The best signals could be those:
- Chart patterns that signal an uptrend if you are trading long.
- Trendlines with the strongest trend strengths.
- With the best confluence of technical indicators.
My point is that you need a consistent basis to guide your decision-making process.
3.4 How to establish the position
Once you have identified the stock and have a target amount to invest, do you slowly build-up to the target amount, or do you buy in one lump sum? You can imagine a similar question when you sell.
In practice, I have never bought or sold in one lump sum. From a buying perspective, this is because:
- If you split the purchases into several tranches, there is a chance that your average purchased price could be lower.
- I have found that after owning a stock, I picked up issues that I missed before. This is probably a behavioural issue. But I find it advantageous to scale into a position rather than buy in one go.
- Investing a large lump sum at once can be emotionally stressful, especially during periods of market uncertainty. Scaling in reduces this stress by breaking down the investment into smaller, more manageable portions.
- For those with limited funds, scaling in can help you build up your stock position
When it comes to selling, I scale out because I have never been able to forecast the peak price. So, scaling out of a position improves my overall selling price.
However, there have been times when the price dropped dramatically after my first sale. These are situations when there was some irrational reason for the price spike. Unfortunately, I can only see this with hindsight.
I still scale-out over 5 or 6 tranches rather than a lump sum sale because there are not many cases of irrational price spikes.
You could improve on your average purchased or selling price if you have a way to identify the market top or bottom. I have come across advice to use technical indicators to do this.
Unfortunately, my transaction period is usually 3 to 4 weeks. For such short durations, I have not been very successful in identifying the market top or bottom using technical analysis. This is after trying with trend, candlesticks, and chart pattern analyses.
In practice, I identify the target price, and then I tried to improve it through scaling in or scaling out as the case applies.
What is the min amount to start investing?
If you take the view that you need 30 stocks to have a diversified portfolio it must mean that you should have enough funds to establish the 30 stocks portfolio.
In the Bursa Malaysia context, the minimum transaction lot size is 100 shares. Accordingly, the minimum amount to start investing is the amount required to buy 100 lots of shares in the 30 identified stocks. Based on an average price of RM 2.00 per share, this means that you will require at least RM 6,000 to start investing.
4. Risk
As a bottom-up stock-picker, it is obvious that your investment risks come from the bottom-up as well as stock picking process. I have several articles that cover these risks. Refer to
The objective of having a stock portfolio is to mitigate the individual stock risks.
However, there are stock portfolio risks that we also have to contend with. These are risks that affect the portfolio as a whole. There are risks than cannot be diversified away. Modern Portfolio Theory refers to these systemic risks. Some examples are:
Market risk. The overall market's performance can impact the portfolio. Factors such as economic conditions, interest rates, and geopolitical events can affect the entire market, potentially influencing your portfolio's performance. Note that MPT solution is to seek higher returns for taking on such risk.
Sector and industry risk. Different sectors and industries may perform better or worse under certain economic conditions. Overconcentration in a single sector can expose your portfolio to heightened risks if that sector experiences difficulties. This is one of the reasons why I have my diversity criteria.
Catastrophic events. Natural disasters like earthquakes, hurricanes, or pandemics can disrupt supply chains, damage infrastructure, and impact multiple sectors of the economy, causing systemic risk.
Currency/sovereign debt risk: If you invest in international stocks, fluctuations in exchange rates can impact returns when converting gains or losses back into your home currency. When a country is unable to service its debt obligations, it can undermine the stability of the global financial system, as creditors and financial institutions holding that debt can face significant losses.
To mitigate these risks regularly review and adjust your portfolio.
It is obvious that you should not allocate all your savings to one asset class such as stocks. That is why an asset allocation plan is part of the stock portfolio risk mitigation measures.
5. Pulling it all together
Building a stock portfolio is a common strategy for individuals looking to grow their wealth over time. However, this investment approach comes with its own set of benefits and issues. The benefits of having a stock portfolio can be summarized as:
- Potential for Wealth Accumulation. By carefully selecting a diversified set of stocks, investors can harness the power of compounding to grow their wealth steadily.
- Income Generation. Stock portfolios can also be a source of income through dividend payments.
- Portfolio Diversification. This is a key strategy in portfolio construction. By spreading investments across various stocks from different industries and sectors, investors can reduce their exposure to individual stock risk.
Some of the issues involved in constructing a stock portfolio includes:
- Risk Management. Your view of risk will affect your approach. For example, if you follow the volatility view of risk, you would look at the Modern Portfolio Theory as the guide in constructing your stock portfolio. But if you follow the permanent loss of capital school, the discussions here would be more appropriate.
- Research and Analysis. Effective stock portfolio construction requires ongoing research and analysis.
- Emotional Decision-Making. Emotions can cloud judgment and lead to impulsive investment decisions. Overcoming emotional biases is a challenge that all investors face. This will impact your portfolio construction.
- Costs and Fees. Investing in stocks often involves transaction costs, such as brokerage fees and taxes on gains. These costs can eat into returns and should be considered when planning a portfolio strategy.
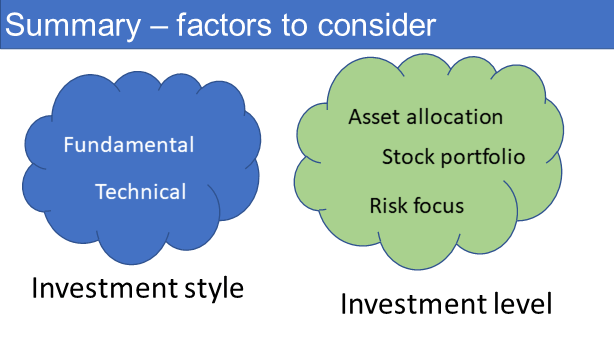
When it comes to constructing your stock portfolio and/or determining the amount to invest in a particular stock, the rules for a fundamental investor are different from those for a trader.
This is because the risk focus is different.
A fundamental investor would aim for a 30-stock portfolio. Then the amount allocated to each stock would be guided by whether he goes for an equal amount for each stock or based on some conviction rules.
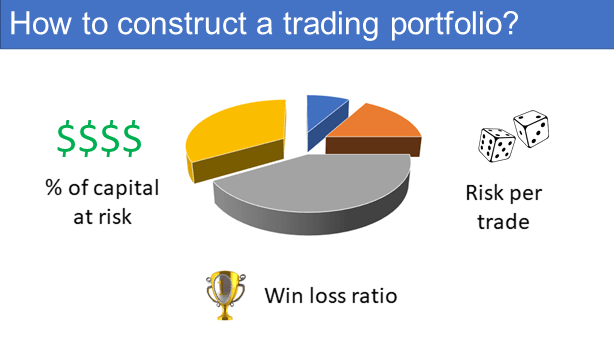
On the other hand, a stock trader would focus on the maximum amount of the capital to risk, and the amount to risk per trade. The number of stocks in the portfolio follows from these.
I would summarize some of the portfolio construction key points into:
- Having a portfolio of stocks is part of the risk mitigation plan.
- You can identify the stocks in the portfolio by either a top-down or bottom-up approach. The important thing is to focus on individual stocks rather than the economy or industry.
- Target to have at least 30 stocks uncorrelated stocks in the portfolio. This is a good balance between maximizing returns from concentration and minimizing risks with diversification.
- Allocate more to those stocks with the most conviction. From a Kelly Formula perspective, this is better than allocating the same amount to all the stocks.
- Scale in and scale out of a position rather than buy or sell in one lump sum.
You can see that as a bottom-up stock picker, the starting point is a good fundamental analysis of the company. This requires skill and experience. If you are a newbie, I would suggest that you complement what you do with insights from experts. There are many sites that provide such analysis such as Seeking Alpha.* Click the link for some free stock advice. They have a long track of business analysis, valuation, and risk assessment and as a member, you can tap into their library.
END
- - - - - - - - - - - - - - - - - - - - - - - - - - - - - - - - - -
How to be an Authoritative Source, Share This Post
If the above article was useful, you can find more insights on how to make money in my e-book. The e-book is now available from Amazon, Kobo and Google Play.
PS: If you are in Malaysia or Singapore, the e-book can only be download from Kobo and Google Play.
How to be an Authoritative Source, Share This Post
|
Disclaimer & DisclosureI am not an investment adviser, security analyst, or stockbroker. The contents are meant for educational purposes and should not be taken as any recommendation to purchase or dispose of shares in the featured companies. Investments or strategies mentioned on this website may not be suitable for you and you should have your own independent decision regarding them.
The opinions expressed here are based on information I consider reliable but I do not warrant its completeness or accuracy and should not be relied on as such.
I may have equity interests in some of the companies featured.
This blog is reader-supported. When you buy through links in the post, the blog will earn a small commission. The payment comes from the retailer and not from you.
Disclaimer & Disclosure
I am not an investment adviser, security analyst, or stockbroker. The contents are meant for educational purposes and should not be taken as any recommendation to purchase or dispose of shares in the featured companies. Investments or strategies mentioned on this website may not be suitable for you and you should have your own independent decision regarding them.
The opinions expressed here are based on information I consider reliable but I do not warrant its completeness or accuracy and should not be relied on as such.
I may have equity interests in some of the companies featured.
This blog is reader-supported. When you buy through links in the post, the blog will earn a small commission. The payment comes from the retailer and not from you.














Comments
Post a Comment