Are there opportunities in the Bursa Energy Services sector?
Case Notes 30. This article looked at the Bursa Malaysia energy services and equipment sector and identified the better companies for further investigation. It also compiled the base rates for the sector.
There are two sub-sectors under the Bursa Malaysia energy sector. They are the Oil & Gas producers and those providing equipment and/or services. This article focused on the latter.
The Oil & Gas producers are expected to achieve record profits in 2022.
“The five super-majors are Exxon Mobil, Shell, Chevron, TotalEnergies, and BP… the 2022 annualized USD 45.2 billion/year of the super-major’s average...is more than double the USD 20 billion/year from 2003 to 2015.” Forbes
Unfortunately, the Malaysian Oil & Gas services and equipment (OGSE) sector does not seem to have the same upbeat outlook.
“Malaysia Petroleum Resources Corporation (MPRC) does not anticipate the OGSE industry to rebound this year despite global crude oil prices breaching USD 100 per barrel”. Source New Straits Times Mar 2022
Given these views, I wanted to see how the Bursa Malaysia companies in the OGSE sector had performed over the past 10 years. I also wanted to see whether there are investment opportunities in the OGSE sector.
Based on my screen, I identified Carimin and Dialog as candidates for further analysis.
Should you go and buy them? Well, read my Disclaimer.
Contents
- Sector background
- Performance
- Screening for investment opportunities
- Method
|
There were 2 goals of my analysis:
- To derive the base rates for the sector.
- To identify the potential companies for further analysis.
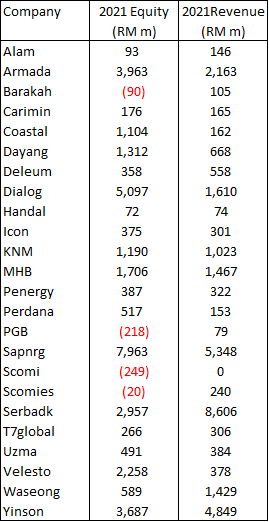
Malaysiastock.biz listed 32 companies under the Bursa Malaysia Energy sector. However, my analysis covered only 24 companies. Refer to Table 1. I excluded the following:
- Hengyuan, Hibiscs, PetronM and Reach. These were categorized as Oil & Gas Producers. I left these out as my focus was on the services and equipment sector.
- OVH, RL and Skhawk. These 3 companies did not have financial data starting from 2013.
- Technax. From the description in its business profile, I judge that its main business was not the supply of services or equipment to the Oil & Gas sector.
The profile of the 24 companies (panel or sector) covered in my analysis is shown in Table 1.
- The 2021 revenue of the panel ranged from RM 0 m to RM 8.6 billion with an average of RM 1.3 billion.
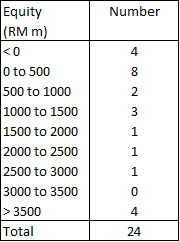
- The 2021 Equity of the panel ranged from RM (249) million to RM 8.0 billion. Contrast this with the KLCI component companies where the smallest company had a Total Equity of RM 550 million.
The following Oil & Gas companies were also excluded from my analysis as they were classified under different sectors:
- Petronas Gas and Gas Malaysia - under Utilities.
- Petronas Dagangan - under Consumer Products and Services.
- Petronas Chemical - under Industrial Products and Services.
- MISC – under Transportation and Logistics.
 |
| Table 1: Profile of Panel |
Sector background
According to the Malaysian Industrial Development Authority (MIDA), the OGSE sector covers the upstream (Oil & Gas) field services, midstream (transportation and storage), and maintenance of machinery and equipment (machinery and equipment).
To develop the local OGSE industry, the MPRC was established in 2011. In 2020/21, MPRC, Economic Planning Unit in the Prime Minister’s Department, together with different ministries, agencies, Petronas, and industry associations developed the National OGSE Industry Blueprint 2021-2030 (Blueprint).
The Blueprint included four strategic pillars - competitiveness, resilience, development, and sustainability. It also had 31 initiatives that will be implemented in three phases starting from 2021.
“The National OGSE Industry Blueprint 2021-2030 aims to provide direction for OGSE companies to improve their competitiveness, efficiency, and technological capabilities…The OGSE industry is expected to contribute between RM 40 billion and RM 50 billion to Malaysia’s gross domestic product by 2030 compared with RM 20 billion last year.
The Blueprint will also be expected to continue to provide 60,000 jobs for talents, a sharp rise in OGSE patent-filing by local entrepreneurs under technology levers, and also instrumental to pushing more OGSEs towards increased sustainability reporting and business practices, with a target of around 70 companies adopting and reporting their sustainability-based business models.” Minister in the Prime Minister's Department Datuk Seri Mustapa Mohamed, The Sun April 2021.
The Blueprint is important as the industry had been hit by the Covid-19 pandemic. At the same time, MPRC did not paint a good picture for 2022.
“The OGSE industry recorded a significantly lower total industry revenue of RM 56.2 billion in 2020 from RM 65.1 billion in 2019 as the overall oil and gas industry was badly hit by low oil prices and COVID-19.
MPRC said the total revenue recorded in 2020 was contributed by 1,328 OGSE companies, which registered a pre-tax loss of RM 4.3 billion during the year with an average loss of margin by 9.2 per cent… the contributing factor of lower revenue includes recognition of impairments by asset-heavy players, namely Sapura Energy at RM 3.2 billion, followed by Velesto Bhd (RM 461.7 million), Bumi Armada Bhd (RM 357.3 million), and MISC Bhd (RM 331.8 million).” Source: New Straits Times Mar 2022
Note that the total revenue in 2021 for the panel was RM 30 billion. Relative to the Blueprint statistics, the contribution of the panel companies is very significant.
Performance
To collect base rates data, I tracked the past 10 years (2013 to 2022) performance of the OGSE companies under the Energy sector of Bursa Malaysia. Note that for many of them the 2022 data were based on the LTM data.
There were 24 companies covered in the panel as shown in Table 1. Refer to the Methodology section for details on how I computed the various metrics.
The profiles of the panel are shown in Tables 2 and 3.
 |
| Table 2: Equity Frequency Distribution |
 |
| Table 3: Revenue Frequency Distribution |
The sector had a very difficult performance over the past 10 years (2013 to 2022).
- The sector median revenue declined at a compounded annual rate of 4.8 % while the sector mean PAT declined at a compounded 185.7 % per annum. Accordingly, the sector ROE had been declining over the past 10 years. This decline began pre-Covid-19.
- The median SHF declined at a compounded 2.4 % CAGR per annum while the median Debt increased at 2.4 % CAGR. The result is that the median Debt Equity ratio of the sector declined at a 5.2 % compounded annual rate.
- Not surprisingly the median cash from operations also declined at a compounded annual rate of 1.1 % CAGR from 2013 to 2022.
Details of the sector’s performance are presented in the following sections.
Revenue
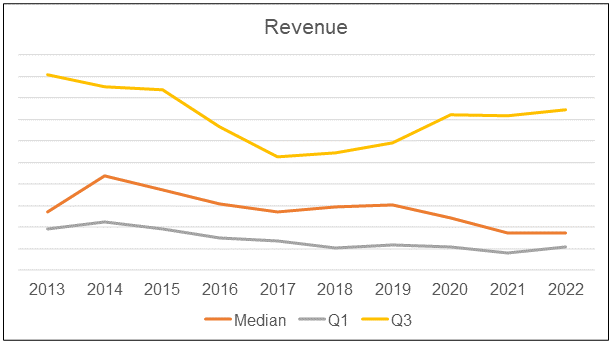
During the first 2 years of the past decade, the industry median revenue grew. But then it dropped thereafter and by 2022, it was lower than that in 2013. This pattern where the 2022 revenue was lower than those for 2013 also applied to the upper quartile (Q3) and lower quartile (Q1).
 |
| Chart 1: Revenue Note: Q3 = upper quartile and Q1 = lower quartile |
A major reason for the revenue pattern was the changes in oil prices. Chart 2 illustrates how the sector median revenue changed with the Brent crude oil prices. The interesting this is that while the Brent prices in 2021 and 2022 have increased relative to that in 2020, the sector revenue did not follow suit.
 |
| Chart 2: Impact of Crude Oil Prices Note: Brent crude oil prices were those as of the end of Jun of the respective years. Data for these were from Trading Economics. |
PAT
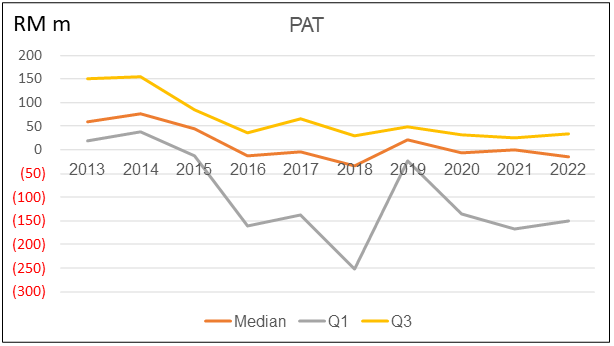
Given the declining revenue, you should not be surprised that the PAT of the sector also declined from 2013 to 2022. Refer to Chart 3.
We see the same pattern where the 2022 PAT is lower than those of 2013. You can see from Chart 3 that the lower quartile values were more volatile than those of the median and upper quartiles. I would interpret this as the performance of the smaller companies being more sensitive to crude oil price changes.
 |
| Chart 3: PAT |
Looking at Chart 2, you will see that the changes in crude oil prices had a bigger impact on the sector PAT than the sector revenue. The correlation between the Brent prices and the sector metrics were:
- 0.06 between oil prices and sector revenue.
- 0.44 between oil prices and sector PAT.
Returns
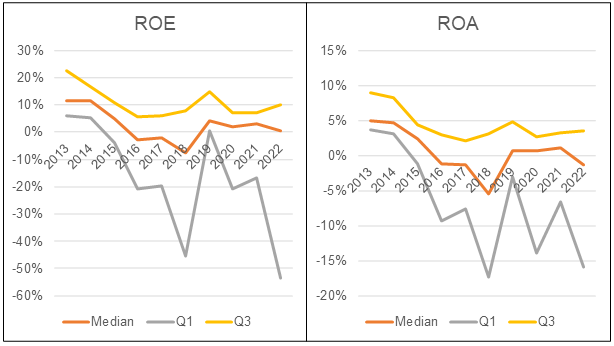
I considered 2 return metrics – ROE and ROA. Refer to Chart 4. The values in 2022 for both the ROE and ROA were lower than the respective values in 2013. It did not matter whether you are looking at the median or quartiles.
From 2013 to 2022, the sector median ROE declined by a compounded annual rate of 28.4 % while the median ROA declined by a compounded annual rate of 185.8 %.
In line with the PAT, the lower quartile returns were more volatile than those of the upper quartiles or medians.
 |
| Chart 4: Returns |
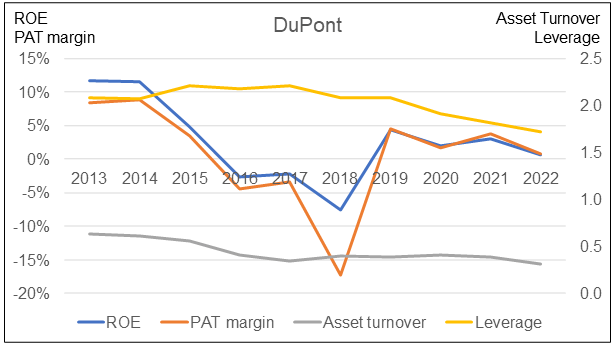
I also carried out a DuPont analysis of the sector median ROE. The DuPont analysis showed that the decline in the ROE was due to the decline in the Profit Margin. But there were also contributions from the decline in Asset Turnover and Leverage. Refer to Chart 5.
 |
| Chart 5: DuPont Analysis of the median ROE |
Capital structure
I would consider the median values when looking at the changes in SHF or Total Assets from 2013 to 2022. As can be seen from Chart 6, there was an increase in the early part of the decade but from 2016/17 onwards the Equity and Total Assets declined.
The sector median Equity declined at a compounded annual rate of 2.4 % from 2013 to 2022. The sector median Total Assets declined at a 2.1 % compounded annual rate for the same period.
I would interpret these as due to the cumulative losses and/or the impairments over the past 10 years.
 |
| Chart 6: Capital Structure |
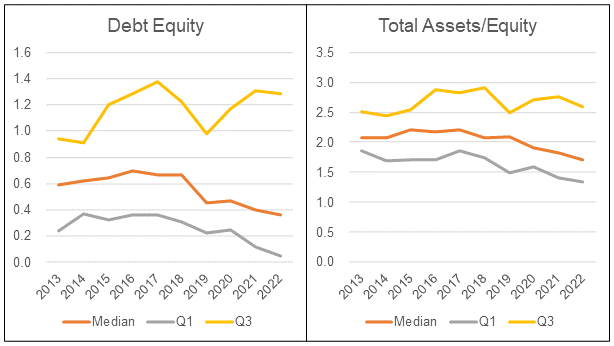
Chart 7 provides a picture of the financial position of the sector:
- While the median Debt Equity was less than 1 and had declined from 2013, the picture is different for the upper quartile Debt Equity ratio. In other words, the Debt Equity ratio of the larger companies had increased over the past 10 years.
- The sector median leverage as measured by Total Assets/Equity has also declined. As for the larger companies, the Total Assets/Equity in 2022 was 2.6 compared to 2.5 in 2013. I would consider it relatively stable.
 |
| Chart 7: Leverage |
Cash flows
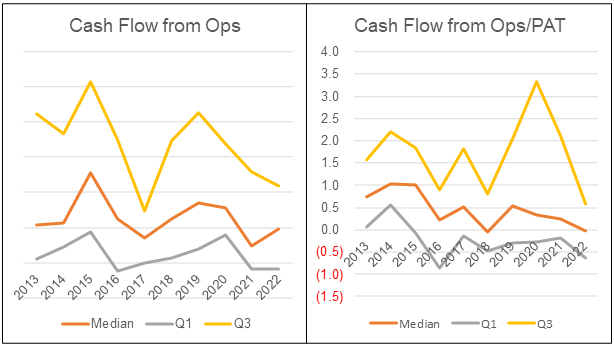
The cash from operations had a more favorable picture compared to PAT. The median PAT from 2013 to 2022 declined by 185.7 % on a compounded annual basis. However, the median Cash Flow from Ops only declined by a compounded annual rate of 1.1 %.
A comparison between the Cash Flow from Ops and the PAT can give you a sense of the quality of earnings. I look for ratios of 1 as this suggests that there are no “excessive accruals” ie a higher quality of earnings.
The Cash Flow from Ops to PAT ratio in Chart 8 suggests a good quality of earnings for the larger half of companies.
 |
| Chart 8: Cash Flow |
Gross profitability
Gross profitability is defined as gross profit divided by total assets.
Professor Robert Novy-Max, University of Rochester, has done considerable research into this metric. According to him, it has roughly the same power as book-to-market in predicting the cross-section of mean returns.
Over the period 2013 to 2022, the sector had a declining gross profitability. Refer to Chart 9. This pattern applies to the median as well as quartiles. If you follow the Novy-Max concept, this meant that the industry returns in the immediate future are not going to be rosy.
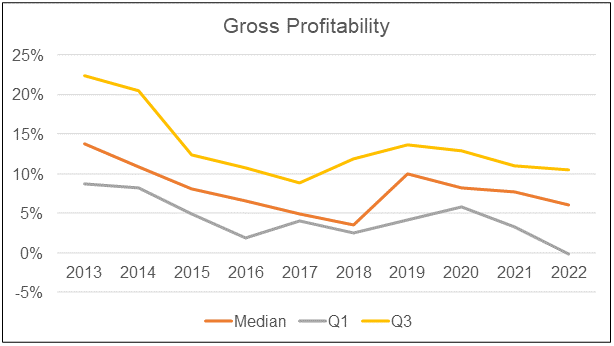 |
| Chart 9: Gross Profitability |
When I compared gross profit margins as per Chart 10 with the Total Assets as per Chart 6, I would conclude that the decline was more due to the Total Assets. To tackle the decline in gross profitability, the sector would have to focus on asset utilization.
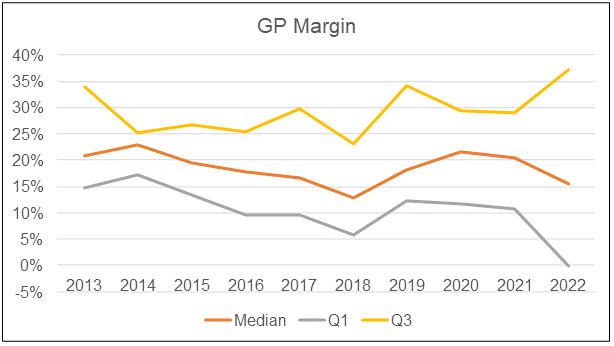 |
| Chart 10: Gross Profit Margin |
Free Cash Flows
I used a simple Free Cash Flow metric of FCFF = Cash Flow from Ops – (CAPEX + Acquisitions – Disposal). The Acquisitions and Disposal include properties and intangibles.
FCFF is related to valuation and the positive sign is that there are uptrends for the median and quartiles. Refer to Chart 11.
 |
| Chart 11: Free Cash Flow |
Screening for investment opportunities
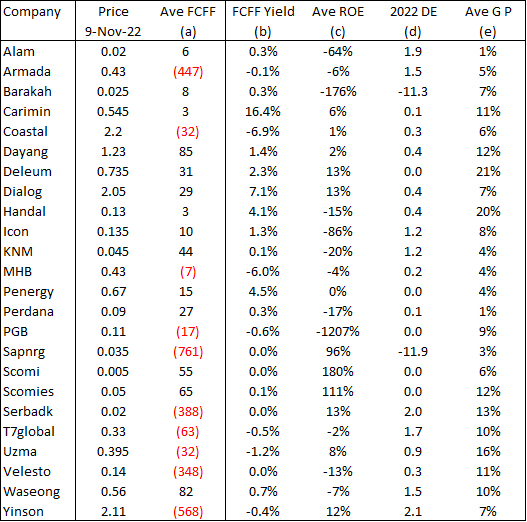
I used 4 metrics to screen for investment opportunities. The first three relate to the business fundamentals while the last relates to valuation.
- ROE. My target is to have > 10% return based on the average ROE from 2013 to 2022.
- Strong financial position. I target companies with a Debt Equity ratio for 2022 of less than 1. Note that as there are some companies with negative Equity, I also excluded those with negative Debt Equity.
- Gross profitability. I consider gross profitability as the main metric to predict stock market returns. The target is to have companies with an average Gross Profitability of > 10 % from 2013 to 2022. The 10% was the average of all the averages in the panel.
- Free Cash Flow Yield > 5%. To derive the yield, I took the average Free Cash Flow from 2013 to 2022 and compared it with the market price as of 9 Nov 2022.
Table 4 summarizes the performance of the panel based on the above metrics.
I then used a simple Pass (denoted by 1 in the table) and Fail (denoted by a blank in the table) to test each company. The results of the test are shown in the following table.
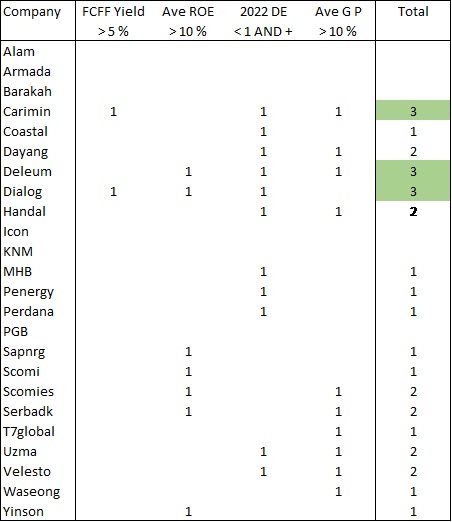 |
| Table 5: Screening Score |
No company met all 4 criteria. But 3 companies had a total score of 3 as highlighted in green in the table – Carimin, Deleum, and Dialog.
I would exclude Deleum as it failed the valuation criteria.
I am not suggesting that you invest in Carimin or Dialog. Rather I recommend that these are candidates for further fundamental analysis if you want to invest in them.
To be transparent I am currently invested in some OGSE companies. I have also written about several Oil and Gas companies. Refer to:
- Is NAIM one of the better Bursa Malaysia stocks? (For its investments in Dayang and Perdana)
Method
The data for the base rates were extracted from the Financial Statements for each company for the period 2013 to 2022. Note that it is comprised of companies with different financial year ends. For many companies, the 2022 values were the LTM values.
The Financial Statements were taken from a platform/app called TIKR.com.
I have 2 types of analyses:
- The average of the sector. This measures the central tendency. The mean is the most frequently used measure of central tendency because it uses all values in the data set to give you an average. For data from skewed distributions, the median is better than the mean because it is not influenced by extremely large values. In this analysis, I have used the median as the measure of central tendency.
- The distribution of individual companies making up the panel. For these, I extracted the quartiles for each year based on the ranking of the respective metric.
When you analyze a panel, there are two perspectives. The first is to look at the performance of the panel as a whole. The second is to focus on the performance of the individual companies. To see the difference between these 2 perspectives, refer to the Methodology section in the following articles:
I am more interested in the performance of individual companies rather than the panel as a whole.
Base rates details
In his book “Thinking Fast and Slow” Daniel Kahneman presented his ideas about the inside and outside view. This is a useful model when analyzing companies.
- The inside view generally refers to a conclusion reached using an individual own experience and reasoning. It is the perspective of someone looking at the problem from “the inside”. The focus is on the specific situation rather than looking at a broader class of similar situations.
- The outside view refers to the perspective of someone looking at the problem "from the outside". It is the view taking into consideration the experience of other people.
When you analyze a company, the inside view may lead to unrealistic expectations. To counter this, you need an outside view.
This is where base rates come in. The performance of the industry would give you a basis to check on your analysis and projections.
All valuations are based on assumptions and the base rates will help to ensure that the assumptions are realistic. I hoped you can assess the performance of a particular company with the average and interquartile ranges.
The information on the base rates presented in this article is a summary of the various metrics. There are a lot of details with me. Different investors look for different things when analyzing companies. As such if you need specific details, do feel free to contact me at i4valueasia@gmail.com.
For a fundamental investor, base rates are important. They help ensure that the assumptions used in the analysis and valuations are realistic. If you do not have such information but still want to invest based on fundamentals, one way is to rely on third-party analysis and valuation.
Several financial advisers provide such analyses. Those who do this well include people like Seeking Alpha.*. Click the link for some free stock valuation examples. If you subscribe to their services, you can tap into their business analysis and valuation.
End
- - - - - - - - - - - - - - - - - - - - - - - - - - - - - - - - -
How to be an Authoritative Source, Share This Post
|
Disclaimer & Disclosure
I am not an investment adviser, security analyst, or stockbroker. The contents are meant for educational purposes and should not be taken as any recommendation to purchase or dispose of shares in the featured companies. Investments or strategies mentioned on this website may not be suitable for you and you should have your own independent decision regarding them.
The opinions expressed here are based on information I consider reliable but I do not warrant its completeness or accuracy and should not be relied on as such.
I may have equity interests in some of the companies featured.
This blog is reader-supported. When you buy through links in the post, the blog will earn a small commission. The payment comes from the retailer and not from you.



Comments
Post a Comment