MKH – will there be another multi-bagger opportunity?
Value Investing Case Study 40-1: A fundamental analysis of MKH Bhd to see whether there is another multi-bagger opportunity. It presents my investment thesis and the rationale for it.
I first invested in MKH Berhad (MKH or the Group) in 2007/08 at an average price of RM 1.56 per share.
There were several bonus issues between 2010 and 2012 including a rights issue. The result was that by the end of 2013, I had doubled the number of shares I had in 2007/08. But my average price per share had reduced to RM 1.13.
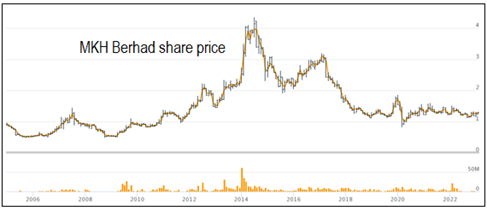
As can be seen from Chart 1, the share price began to spike in 2014 to be about 4 times my average cost. I then sold about 80% of my shareholdings. I held onto the balance 20% hoping for higher prices.
 |
| Chart 1: MKH Share Price |
But the price began to drop and as can be seen from Chart 1, it reached my 2007/08 average cost by 2018/19. I then not only bought back what I sold, but I bought an additional 50 % more. My current average purchased cost (including bonus) is RM 1.18 per share.
But the price has not moved much since then. Do I expect another multi-bagger opportunity? Yes. Join me as I explain the rationale for my optimism.
Should we go and buy it? Well, read my Disclaimer.
Contents
- Company profile
- Business performance
- Peer comparison
- Value creation
- Prospects
- Valuation
- Investment Thesis
- Conclusion
|
Company profile
Established in 1979, MKH Berhad (“MKH”) is a Malaysian publicly listed company originating from Kajang, Selangor. Today it has established a prominent brand presence in Selangor, Kuala Lumpur, and East Kalimantan, Indonesia.
The Group started in 1979 as a property developer. Today it has two major revenue segments – Property Development and Plantations. A brief history of the Group’s diversification is listed below:
- 1983 – established the building materials trading business.
- 1990 – ventured into furniture manufacturing.
- 1994 – ventured into property investment.
- 2002 – relocated furniture manufacturing to China.
- 2008 – ventured into oil palm plantation with estates in Kalimantan.
You can see from Chart 2 that from 2007/08 to 2020/21 the revenue profile of the Group had changed.
 |
| Chart 2: Comparative Segment Revenue |
Business Performance
Over the past 15 years, the Group revenue had grown at 7.9 % CAGR. But as can be seen from Chart 2, a significant contributor was the Plantation segment. The other major contributors to the growth were:
- The Property Development segment with 6.1 % CAGR.
- The Trading segment with 9.9 % CAGR.
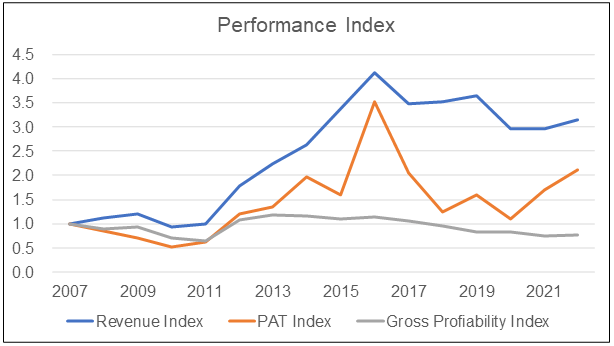
While revenue grew, PAT did not match the growth rate. Refer to Chart 3. Note the spike in PAT in 2016. There were 2 main reasons for this spike:
- An unrealized foreign exchange gain of RM 39.5 million for the Plantation segment. There was also an unrealized foreign exchange losses of RM 37.0 million in 2015.
- Higher revenue and profit recognition for the Property Development segment.
At the same time, Gross Profitability (Gross Profits / Total Assets) over the past few years were lower than that in 2007. My key concern was the declining trend in the Gross Profitability from around 2012/13.
 |
| Chart 3: Performance Index |
According to Professor Novy-Marx, this metric has the same power as Price to Book in predicting cross-section returns. Gross Profitability can also be thought of as an efficiency indicator. A declining trend meant that the Gross Profits declined as the Total Assets increased.
To verify this, I carried out a DuPont analysis as shown in Chart 4. Note the blip in 2016 due to the extraordinary PAT.
 |
| Chart 4: DuPont Analysis |
Table 1 shows the changes in the various DuPont metrics. You can see that the current ROE is about half of that in 2007/08. The reduction in the ROE is contributed by all the metrics with the Profit margin having the biggest impact (in terms of the proportionate drop).
 |
| Table 1: Comparative DuPont Metrics |
You can see that the ROE had declined over the past 15 years. The current ROE is nothing to shout about. Part of the reason for the poor ROE was that not all the cylinders were firing.
MKH started as a property developer. Based on the Total Capital Employed (TCE), the Property Development segment accounted for about slightly less than half of the resources. The Malaysian property market was soft since the mid-2010s following the government measures to cool property speculation. Then of course came Covid-19.
Covid-19 badly affected the hospitality and leisure sectors. You can see this clearly in the return for the Hotel & Property investment segment. Without the Plantation segment, the Group performance would be much worse.
 |
| Table 2: Segment Performance Notes a) TCE = SHF + MI + Debt. The TCE for each segment was adjusted for cash so that it went to the Others/Consol segment. b) Average of 2020 to 2022. |
Financial strengths
I would rate MKH as financially sound for the following reasons.
- As of the end Sep 2022, it had a current ratio of 1.6 and a Debt Equity ratio of 0.2.
- It has RM 391 million of cash as of the end Sep 2022. This is about 11 % of the Total Assets.
- If its Debt was rated, it would have an A+ rating (Fitch). The rating was based on Damodaran synthetic rating approach using the interest coverage ratio.
- Over the past 16 years, there were only 2 years where the Group had a negative Cash Flow from Operations. The Group generated on average about RM 115 million in Cash Flow from Operations annually. Compare this to the RM 88 million average PAT generated annually for the same period.
I would also commend the Group for the use of its funds. From 2007 to 2022, the Group generated RM 2.026 billion in funds. The majority was from Cash Flow from Operations while Debt increased by RM 184 million. Refer to Table 3.
The majority of the funds were used in CAPEX – additional PPE and new properties. The Group had used the funds to diversify into oil palm plantations as well as build up its Hotel & Property Investment portfolio. Only 14 % of the funds were paid to the shareholders as Dividends & share buybacks.
The only concern I have is with the Cash Conversion cycle. It increased from about 205 days in 2007/8 to about 370 days in 2021/22. But I am not sure how much of this was due to the changes in the profile of its business. One way to judge this is to compare this with some peers.
Peer comparison
MKH currently has a shareholders’ fund of RM 1.8 billion (as of Sep 2022). I thus compared its performance with property companies with shareholders’ funds greater than RM 1 billion. I undertook 2 types of peer comparisons.
- Compared the Cash Conversion cycle with several companies that had about the same revenue of MKH. This are those with shareholders’ funds > RM 1 billion and about RM 1 billion revenue annually for the past few years.
- Compared MKH on several metrics with the Bursa Malaysian large property sector. These were defined as companies with Shareholders’ funds > RM 1 billion as of 2020.
Based on both comparisons, I would rate MKH’s performance as better than average.
Chart 5 shows the Cash Conversion cycle comparison. You can see that the peers experienced similar increases in the number of days in the second half of the decade. I would conclude that MKH did well in terms of having a lower number of days.
 |
| Chart 5: Peer Cash Conversion Cycle |
Table 4 compared MKH’s performance with those of the sector on several metrics. The sector performance was based on the base rates presented in my article "Will the Malaysian Property Industry turn around by 2024? ". They covered the 2010 to 2020 period.
MKH’s revenue growth rate, Gross Profitability, and Asset Turnover were significantly better than those of its peers. But MKH had a higher DE ratio compared to its peers. Overall, I would rate MKH’s performance as better than its peers.
 |
| Table 4: Peer Comparison |
|
Value creation
I look at the following to assess whether there has been value creation.
- I compare the returns with the appropriate cost of funds. Value is created if the returns exceed the cost of funds.
- I look at the Q Rating to see whether it is better than the average to denote value creation.
In looking at returns, I considered the performance of the business as well as the actual return achieved by a shareholder. Table 5 summarizes the results.
You can see that from a business perspective, there was value creation. However, from a shareholders’ gain perspective, there was no value creation. This was because there was hardly any capital gain during the analysis period.
Q Rating
MKH has an overall Q rating score of 0.56 placing the Group just above the 75th position in the panel. The best is the 100th position and the worst would be the 1st position. The rating reflects a good risk profile and strong financial position. For details on the Q Rating refer to “How To Mitigate Risks When Value Investing”.
In conclusion, taking into account the returns and the Q Rating, MKH had created shareholders’ value.
 |
| Chart 6: Q Rating |
Prospects
I would rate the long-term business prospects as good as properties and oil palm plantations are not sunset industries. While there is short-term pain due to Covid-19 and the cyclical factors, the Group has the financial strength to withstand any prolonged downturn.
Property
The Malaysian property market has been soft since the mid-2010s long before Covid-19. However, with the opening of the economy, I believe that we are at the bottom of the trough. For a detailed look at this sector, refer to “Will the Malaysian Property industry turn around by 2024?”
The prospects for property development look good. The Group currently has about 620 acres of land for development with a weighted average age of 10 years. I estimated them to cost about RM 33 per sq ft. In other words, the Group has reasonably cheap land. At its height, the Property Development segment was delivering returns that were easily doubled that shown in Table 2.
With the opening of the economy, I expect the Hotel and Property investment segment to deliver better returns than the 1 % shown in Table 2. In the mid-2010s, this segment generated an average EBIT of RM 28 million compared to RM 11 million in 2022.
Plantation
For details on the sector, refer to “How the Malaysian plantation sector performed over the past 8 years”.
The Group has 18,338 hectares of plantation land in East Kalimantan, Indonesia with about 90 % planted. The planted areas have reached the mature age for harvesting.
In 2022, the Group achieved a harvesting yield of 24 MT per hectare. This is comparable to the yield achieved by the top Malaysian plantation companies. According to Statista, the average Malaysian yield in 2021 was 15.5 MT per hectare.
I do not expect a quantum leap from this sector as this is not only a capital-intensive business but there is also a long gestation period.
- The Group ventured into an oil palm plantation in 2008. It took them 15 years to get to this stage.
- In 2014, the Group had 15,900 hectares of plantation land. Over the past 8 years, the land area had increased by 15%.
The Plantation segment TCE today is RM 383 million. This is equivalent to investing about RM 26 million annually. The Group may continue to increase its plantation land. But I suspect that it would do so at the historically slow and steady rate.
If you look at Chart 7, you can see that the Plantation segment accounted for about half of the EBIT for the past 2 years. The Property Development EBIT contribution had declined to less than half of its 2016 peak. I expect the Property Development segment’s EBIT to be between the 2017 and 2022 amounts.
Given these, I expect the steady EBIT for the Group to be between RM 200 million and RM 250 million per year. I would not model MKH as a high-growth company but as a mature one with steady growth.
 |
| Chart 7: Segment EBIT |
Valuation
I use 3 metrics to triangulate the intrinsic value of MKH. Table 7 summarised them. You can see that based on the current market price there is a sufficient margin of safety.
My average purchase cost is RM 1.18 per share. This is significantly below the Asset Value or the Earnings Power Value (EPV).
My EPV valuation models were based on Damodaran (FCFF) and Penman (Residual Income) approaches. For details on the method, refer to “Is Glomac a value trap?”. The key point is that EPV ignores growth. This is not unreasonable given that I have shown that MKH is not a high-growth Group.
A significant portion of MKH assets is in properties. These are either land & buildings or plantation land. As such I would consider the Asset Value as a good floor value. So even ignoring the EPV, there is already a good margin of safety.
At the same time, MKH’s Acquirer’s Multiple of 3.7 makes it an attractive target. The rule of thumb is that anything lower than 6 is a good price.
Limitations and risks of EPV
The EPV of MKH is based on the past 12 years’ time-weighted average operating EBIT of RM 195 million. It is a conservative estimate considering that I expect the steady stage EBIT to be between RM 200 million to RM 250 million.
Nevertheless, the computed EPV is significantly higher than the Asset value. This was because of the way I estimated the value of the non-operating assets.
Value of the Firm = value of the operating assets based on the DCF + value of the non-operating assets.
My valuation model for property developers differs from that for manufacturing companies in my treatment of non-operating assets.
- In manufacturing companies, I consider cash, securities, and investment in associates as non-operating assets.
- In the case of property companies, in addition to the above, I also consider excess land as non-operating assets.
This is because many Malaysian property developers have landbank that far exceeds what they normally need to use over the next 5 to 6 years. In many cases, the land bank continues to grow.
As such, if the landbank is increasing as for MKH, I treat any land over the normal usage as non-operating assets. At the same time, I also re-valued the land held for development based on a 5% annual appreciation. I treated this as a revaluation surplus.
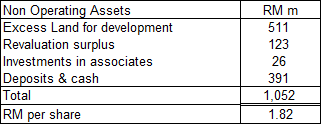
For MKH, the non-operating assets are summarized in Table 8. You can see that this is equal to RM 1.82 per share. Note that the non-operating assets are only taken into account in the EPV. The Assets Value does not include the revaluation surplus.
Even if you ignore the Excess Land for development and the Revaluation surplus, the EPV of MKH is RM 3.66 per share. This is still higher than the Asset Value.
 |
| Table 8: Non-operating Assets Note: I assumed that the revaluation surplus is after 24% taxes |
Investment Thesis
MKH has two major profit contributors – Property Development and Plantation.
The Plantation segment is cyclical and has reached “maturity”. While cyclical, the Property Development segment cycle is different from that of the Plantation segment.
The Malaysian property market has been soft since the mid-2010s. This was the result of several measures by the government to reduce property speculation. Covid-19 aggravated the situation. But with the post-Covid-19 opening of the economy, the bottom of the cycle has been reached.
The negative market sentiments have also not helped. Many property developers are today trading at less than half of their NTA.
I expect the property performance of MKH in the coming years to improve. Together with the expected improvement in the market sentiments, the market price of MKH would be much higher than what it is today.
|
Conclusion
There are two general questions value investors ask before investing in a company:
- Is it a good company? In other words, is it fundamentally strong?
- Is it a good investment? I assess this by looking at whether there is a sufficient margin of safety (> 30 %) at the current price.
My analysis and valuation of MKH are intended to answer these questions. I believe that the answers to both of them are positive.
The unknown is how long I have to wait before the market re-rates MKH. In 2007/08, I waited for about 7 years. I suspect that I will have to wait for at least another 3 to 4 years.
MKH is different from other property companies in that it has an oil palm plantation business whose cycle is different from the property cycle. This has helped to “smoothen” the earnings.
But if you have a situation where the peak of the oil palm and property cycle coincides, we will have super profits. And I expect the market to react strongly. This is where the multi-bagger opportunity comes in.
END
- - - - - - - - - - - - - - - - - - - - - - - - - - - - - - - - - -
- - - - - - - - - - - - - - - - - - - - - - - - - - - - - - - - - -
How to be an Authoritative Source, Share This Post
If the above article was useful, you can find more insights on how to make money in my e-book. The e-book is now available from Amazon, Kobo and Google Play.
PS: If you are in Malaysia or Singapore, the e-book can only be download from Kobo and Google Play.
How to be an Authoritative Source, Share This Post
|
Disclaimer & DisclosureI am not an investment adviser, security analyst, or stockbroker. The contents are meant for educational purposes and should not be taken as any recommendation to purchase or dispose of shares in the featured companies. Investments or strategies mentioned on this website may not be suitable for you and you should have your own independent decision regarding them.
The opinions expressed here are based on information I consider reliable but I do not warrant its completeness or accuracy and should not be relied on as such.
I may have equity interests in some of the companies featured.
This blog is reader-supported. When you buy through links in the post, the blog will earn a small commission. The payment comes from the retailer and not from you.
Disclaimer & Disclosure
I am not an investment adviser, security analyst, or stockbroker. The contents are meant for educational purposes and should not be taken as any recommendation to purchase or dispose of shares in the featured companies. Investments or strategies mentioned on this website may not be suitable for you and you should have your own independent decision regarding them.
The opinions expressed here are based on information I consider reliable but I do not warrant its completeness or accuracy and should not be relied on as such.
I may have equity interests in some of the companies featured.
This blog is reader-supported. When you buy through links in the post, the blog will earn a small commission. The payment comes from the retailer and not from you.


Comments
Post a Comment