Stock picking portfolio vs MPT
Fundamentals 20-8: This is the Sep 2023 review of the stock-picking portfolio that was first established at the start of 2022. I also look at the differences between a stock-picking portfolio and that based on Modern Portfolio Theory (MPT).
In Jan 2022, I constructed a stock portfolio based on the companies that I had analyzed and valued over the past year. The goal was to track the portfolio performance to provide insights into establishing and managing a stock portfolio.
This is my seventh quarterly review. The goals of each portfolio review were:
- To determine the portfolio return.
- To ensure that the portfolio still meets the diversity criteria.
In this article, I will also cover the differences between a stock-picking portfolio and that based on the Modern Portfolio Theory (MPT).
This post builds on the data from the various tables presented in my earlier articles in this series. To benefit from this article, you should first read the following:
Contents
- Tracking performance
- End Sep 2023 Returns
- End Sep 2023 Diversity
- Stock picking portfolio vs MPT
- Conclusion
|
Tracking performance
To recap, I started with a USD 100,000 investment fund. I then added another USD 10,000 at the end of 2022.
I did not use all the money when I established the portfolio. There is some balance cash. When looking at performance, I will look at it from the fund perspective rather than just the stock portfolio perspective. For the avoidance of doubt:
- The portfolio refers to the stocks that I invest in.
- The fund refers to both the value of the stock portfolio and the unutilized cash.
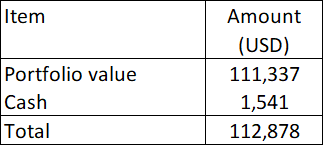
The total fund value as of the last review date (end of June 2023) was USD 112,878 as per Table 1. Refer to "How to grow the stock picking portfolio value?” for details.
 |
| Table 1: Total Fund Value as of the end of June 2023 |
Over the last 3 months, I sold and bought some stocks.
- I sold all my Boustead Plantation at an average price of RM 1.40 per share as its price was up-trending. I later found out that KLK was buying it from LTAT at RM 1.55 per share. The deal was eventually called off but LTAT decided to continue with the general offer at RM 1.55 per share.
- I sold NVR as I viewed that the US Housing Start was peaking.
- I sold United States Steel following the announcement that Cleveland Cliff was considering a takeover exercise.
- I bought MDC as my analysis showed that this home builder was still an investment opportunity. Refer to “M.D.C. Holdings: Not The Best Financially But Has A Margin Of Safety”
- I bought Ryerson based on my analysis of this US steel center company. Refer to ”Ryerson Made Hay While The Sun Shone. But Is The Sun Still Shining?”
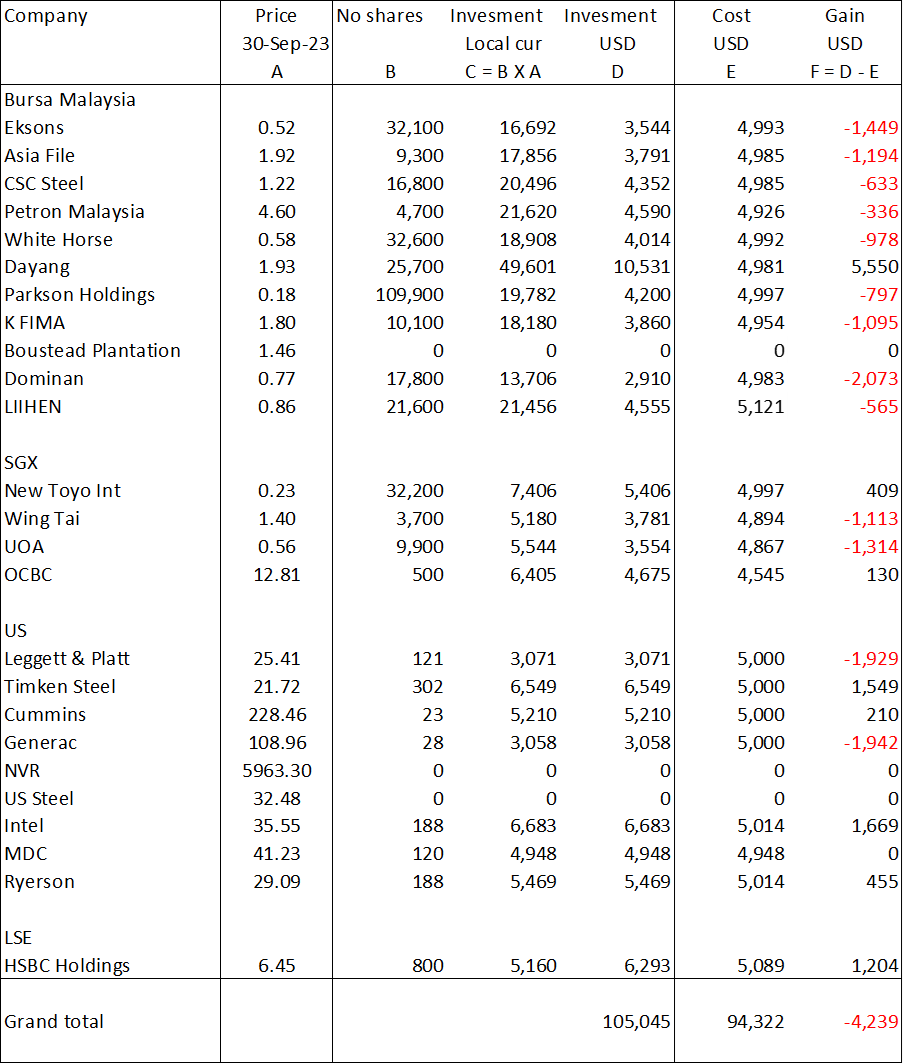
This affected the value of the portfolio as of the end of Sep 2023 as shown in Table 2.
 |
| Table 2: Portfolio as of the end of Sep 2023. |
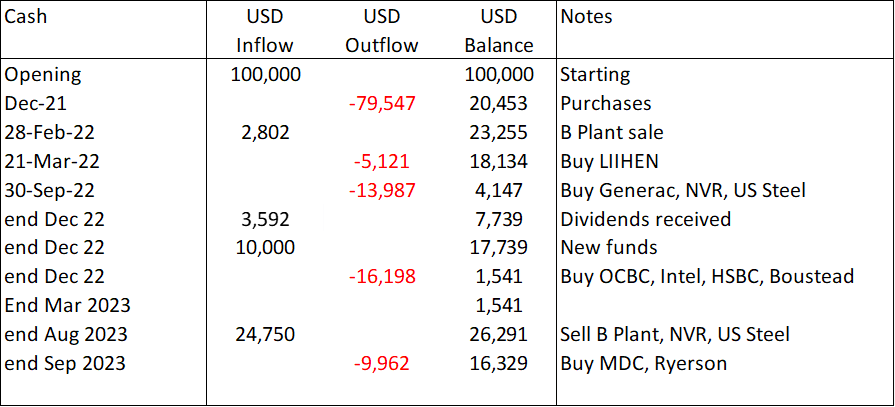
At the same time, there were changes to the cash positions as shown in Table 3. You can see that the cash had increased to USD 16,329 at the end of Sep 2023 compared to USD 1,541 at the end of June 2023.
 |
| Table 3: Cash Position as of the end of Sep 2023 |
As I did not use all the cash to buy new stocks, the total portfolio value decreased to USD 105,045 (refer to Table 2) compared to USD 111,337 as of the end of June 2023 (refer to Table 1).
The total fund value at the end of Sep 2023 then became USD 112,878 as per Table 4.
 |
| Table 4: Total Fund Value as of the end of Sep 2023 |
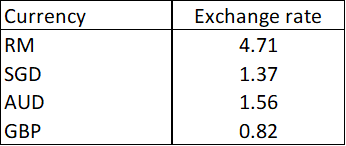
Note that to derive the portfolio value in USD, I used the updated forex rates as per Table 5.
 |
| Table 5: Forex Rates at the end of Sep 2023: 1 USD to the respective currencies. |
Recap
When it comes to assessing performance, I consider the following 3:
- Look at absolute returns.
- Compare the returns with those of the benchmarks.
- Compare the returns on a risk-adjusted basis.
When it comes to the fund or stock portfolio, the return is complicated by the following situations:
- During the period, some of the stocks could have lost money. You could have a negative total gain if a capital loss is larger than the dividends.
- You could have sold off some stocks and be holding cash. Alternatively, you could be holding onto some dividends in cash form rather than have them reinvested during the review time.
- You could have allocated additional cash to the funds. In other words, the amount set aside for investment is bigger not because of any gain, but because of additional funds.
To cater to such situations, I define the total gain and return in the following manner.
- Total Gain = current value - previous value + dividends.
- The Total Returns for the period = Total Gain divided by the previous value.
- The fund value includes any un-invested cash.
I used the market value of the stocks in the portfolio to calculate the portfolio value. It is the sum of the market value of the respective stocks. The current and previous values refer to the value of the portfolio assuming it is liquidated.
The market value of a particular stock = number of shares held × market price. The number of shares held currently may be different from the number of shares held before. This could be due to bonus issues and or other corporate activities.
To ensure that I am comparing apples to apples, I also include any dividends or money that I have received that has not been reinvested.
- The dividends refer to all the dividends received during the annual review period. Since there is a likelihood that you may reinvest the dividends, I look at the after-tax value of the dividends received.
- The cash on hand could be money pending reinvestment or money taken out.
I hope that I have shown you how to handle various situations through the past few articles. I have provided work examples so that you can see the “mechanics” of the computation.
To ensure a meaningful comparison, I recommend considering quarterly performance excluding dividends. Then on an annual basis, I would consider a total return basis ie including dividends.
Along the same lines, I would assess the Information Ratio and Jensen Alpha only on an annual basis.
|
End Sep 2023 Returns
The fund returns for the quarter ended Sep 2023 = (121,375 – 112,878) / 112,878 = 7.5 %.
A summary of the quarterly and annual returns over the past few quarters is shown in Table 6.
Benchmarking returns
You can see that the portfolio gained when looking at the latest quarter. Now whether this is a good performance can only be gauged by comparing it with some reference performance or benchmark.
In my previous article, I created a benchmark based on the following:
- KLCI for Bursa Malaysia.
- STI for SGX.
- S&P 500 for the US.
- FTSE100 for the London Stock Exchange.
The weights for each benchmark are the value of funds allocated to the respective stock exchange at the beginning of the period. Refer to Table 7 which estimated the benchmark return.
You can see that the benchmark gained 0.4 % for the quarter compared to the fund gain of 7.5 %. I would consider this a good performance.
I have not attempted to compute the benchmark return from the start of the fund for this quarter.
- The quarterly total gains for the benchmarks are difficult to find.
- The weights used in the benchmark quarterly review differ from quarter to quarter. Refer to the previous post “How often do you review the stock picking portfolio?” for an illustration.
For these reasons, when it comes to estimating the benchmark returns, I differentiate between the following:
- The quarterly returns where I have ignored dividends.
- The annual returns which are based on a total return basis ie with dividends.
Summary of performances
Table 8 summarizes the performance of the fund based on my recommended approach.
For 2022, the fund with a -2.0 % return on an annual basis (including dividends) did worse than the benchmark with a -1.3 % return.
But since then, the 2023 returns for all the quarters (excluding dividends) for the fund outperformed the benchmark.
 |
| Table 8: Summary of Performance Note: Refer to the previous article of this series for the computation of the Information ratio and Jensen Alpha. |
End Sep 2023 Diversity
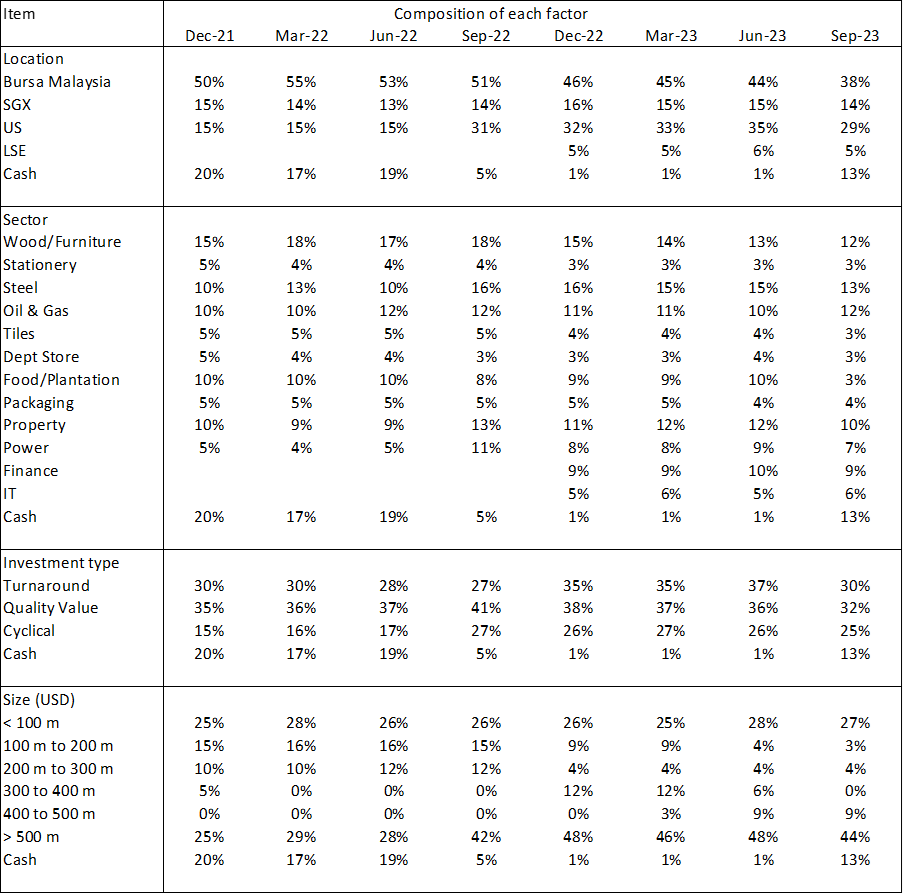
The goal of a portfolio is to have about 20 to 30 uncorrelated stocks. You will have difficulty computing the covariances required to determine the correlations. As such, I used a rule of thumb to ensure diversity.
- Single stock concentration - the market value of a stock should not be more than 10% of the market value of the total portfolio.
- Group concentration - the market value of the stocks within a group should not be more than 30% of the market value of the total portfolio.
Refer to my earlier post on this series for the details. The diversity profile at the end of Sep 2023 is presented in Table 9.
You can see that cash increased in this quarter compared to the previous quarter. But the concentration within each group reduced in this quarter.
 |
| Table 9: Diversity Profile |
Stock picking portfolio vs MPT
A stock-picking portfolio and one based on MPT are two different approaches to constructing a stock portfolio.
Stock-picking portfolios are based on the belief that an investor can identify and select individual securities that will outperform the market. Stock picking can be more subjective and relies heavily on individual judgment, while MPT is based on quantitative analysis and objective measures of risk and return.
As such, many think that stock-picking portfolios are associated with higher individual stock risk, while MPT portfolios aim to reduce overall portfolio risk through diversification.
I have of course a risk mitigation framework that addresses many of the risk issues associated with a stock-picking portfolio. For details refer to my article “How to mitigate permanent loss of capital in an awesome way”
The key differences between them can be summarized as follows:
Stock-Picking Portfolio
- Individual Stock Selection: The goal is to identify specific stocks that will outperform the market or their peers.
- Active Management: The portfolio is actively rebalanced to capitalize on perceived opportunities and avoid underperforming stocks.
- Diversification: I target 30 stocks based on my diversity rules.
MPT
- Diversified Portfolio: MPT emphasizes the creation of a portfolio that combines assets with different risk-return profiles to achieve an optimal level of risk and return.
- Quantitative Analysis: MPT relies on quantitative analysis to determine the ideal asset allocation for a given level of risk tolerance. It seeks the "efficient frontier" of portfolios that provide the maximum expected return for a given level of risk or the minimum risk for a given level of expected return.
- Passive or Index Investing.
Those following the debate between a stock-picking portfolio and MPT should keep in mind that I have a stock-picking portfolio because I am a stock-picker. I am a stock-picker because I believe that this will enable me to beat the market.
The stock-picking portfolio results from my stock-picking investment approach. I cannot be a stock-picker yet follow MPT when it comes to portfolio construction.
Conclusion
There are 2 key questions when reviewing and interpreting the results of the portfolio review:
- How did we perform?
- Are we still well diversified?
What I said in my previous article is still valid:
- Compare quarterly returns excluding dividends to assess how well the fund has performed during the year.
- Compare annual returns on a total return basis to assess how well the fund has performed year-to-year.
- Use the Information Ratio and Jensen Alpha on an annual basis.
Based on this, the portfolio in 2022 did not perform as well as the benchmark. But in the following 3 quarters, the portfolio outperformed the benchmark.
In the context of risk management, I am satisfied that the portfolio at the end of Sep 2023 is still diversified.
Note that I have yet to use the portfolio review to check for investment mistakes. I will illustrate this in due course when I have held the stocks for several years.
END
- - - - - - - - - - - - - - - - - - - - - - - - - - - - - - - - - -
How to be an Authoritative Source, Share This Post
|
Disclaimer & Disclosure
I am not an investment adviser, security analyst, or stockbroker. The contents are meant for educational purposes and should not be taken as any recommendation to purchase or dispose of shares in the featured companies. Investments or strategies mentioned on this website may not be suitable for you and you should have your own independent decision regarding them.
The opinions expressed here are based on information I consider reliable but I do not warrant its completeness or accuracy and should not be relied on as such.
I may have equity interests in some of the companies featured.
This blog is reader-supported. When you buy through links in the post, the blog will earn a small commission. The payment comes from the retailer and not from you.


Comments
Post a Comment