Stock picking portfolio – March 2024 review and template
Fundamentals 20-10: This is the March 2024 review of the stock-picking portfolio that was first established at the start of 2022. I also share my template for tracking the portfolio performance.
In Jan 2022, I constructed a stock portfolio based on the companies that I had analyzed and valued. The goal was to track the portfolio performance to provide insights into establishing and managing a stock portfolio.
This is my ninth quarterly review. The goals of each portfolio review were:
- To determine the portfolio return.
- To ensure that the portfolio still meets the diversity criteria.
This post builds on the data from the various tables presented in my earlier articles in this series. To benefit from this article, you should first read the following (in chronological order):
In this article, I also share the EXCEL worksheets that I used to track the portfolio performance. I hope that you can use it as a template to track your portfolio.
Contents
- Tracking performance
- End Mar 2024 Returns
- End Mar 2024 Diversity
- My stock-picking portfolio template
- Conclusion
|
Tracking performance
When looking at performance, I will look at it from the fund perspective rather than just the stock portfolio perspective. For the avoidance of doubt:- The portfolio refers to the stocks that I invest in.
- The fund refers to both the value of the stock portfolio and the unutilized cash.
To recap, I started at the end of 2021 with a USD 100,000 investment fund. I then added another USD 10,000 at the end of 2022.
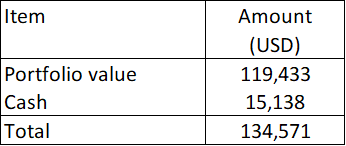
The total fund value as of the last review date (end of Dec 2023) was USD 134,471 as per Table 1.
 |
| Table 1: Total Fund Value as of the end of Dec 2023 |
From the end of Dec 2023 till 31 March 2024, I bought 2 companies:
- Sleep Number Corporation, a US-listed bedding company.
- Sealed Air Corp, a US-listed packaging company.
You can find further details on the company on Seeking Alpha by clicking on the links. This affected the value of the portfolio as of the end of March 2024 as shown in Table 2.
 |
| Table 2: Portfolio as of the end of March 2024 |
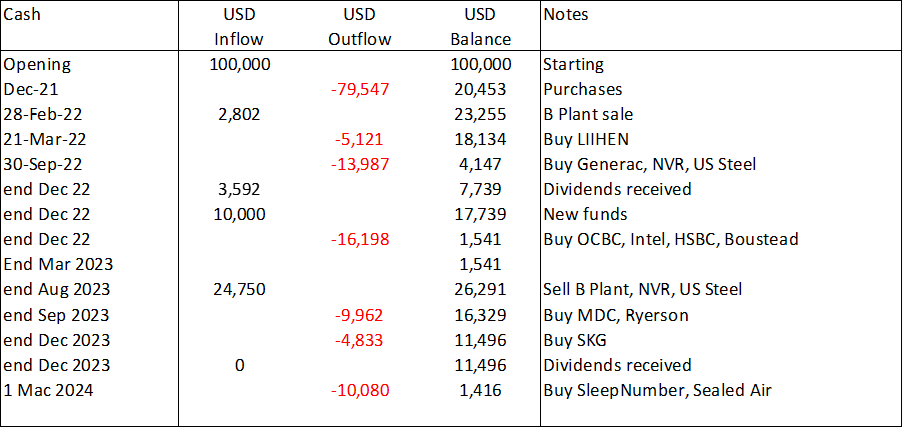
At the same time, there were changes to the cash positions as shown in Table 3. You can see that the cash had reduced to USD 1,416 at the end of March 2023 compared to USD 15,138 at the end of Dec 2023.
 |
| Table 3: Cash Position as of the end of March 202 |
The total fund value at the end of March 2024 became USD 136,553 as per Table 4.
 |
| Table 4: Total Fund Value as of the end of March 2024 |
Recap
When it comes to assessing performance, I define the total gain and return in the following manner.
- Total Gain = current value - previous value + dividends.
- The Total Returns for the period = Total Gain divided by the previous value.
- The fund value includes any un-invested cash.
I used the market value of the stocks in the portfolio to calculate the portfolio value. It is the sum of the market value of the respective stocks. The current and previous values refer to the value of the portfolio assuming it is liquidated.
The market value of a particular stock = number of shares held × market price. The number of shares held currently may be different from the number of shares held before. This could be due to bonus issues and or other corporate activities.
To ensure that I am comparing apples to apples, I also include any dividends or money I have received that has not been reinvested.
- The dividends refer to all the dividends received during the annual review period. Since there is a likelihood that I may reinvest the dividends, I look at the after-tax value of the dividends received.
- The cash on hand could be money pending reinvestment or money taken out.
To ensure a meaningful comparison, I recommend considering quarterly performance excluding dividends. Then on an annual basis, I would consider a total return basis ie including dividends.
Along the same lines, I would assess the Information Ratio and Jensen Alpha only on an annual basis.
End March 2024 Returns
The fund returns for the quarter ended March 2024,
= (136,553 – 134,571) / 134,571 = 1.5 %. The quarterly returns ignored dividends. I have earlier mentioned that I considered dividends on an annual basis.
A summary of the quarterly and annual returns over the past few quarters is shown in Table 5.
Benchmarking returns
You can see that the portfolio gained when looking at the latest quarter. Now whether this is a good performance can only be gauged by comparing it with some reference performance or benchmark. I estimated the returns based on the benchmark I created previously. Refer to Table 6.
You can see that the benchmark gained 5.4 % for the quarter compared to the fund gain of 1.5 %. I would not consider this a good performance for the fund.
End March 2024 Diversity
The goal of a portfolio is to have about 20 to 30 uncorrelated stocks. You will have difficulty computing the covariances required to determine the correlations. As such, I used a rule of thumb to ensure diversity.
- Single stock concentration - the market value of a stock should not be more than 10% of the market value of the total portfolio.
- Group concentration - the market value of all the stocks within a group should not be more than 30% of the market value of the total portfolio.
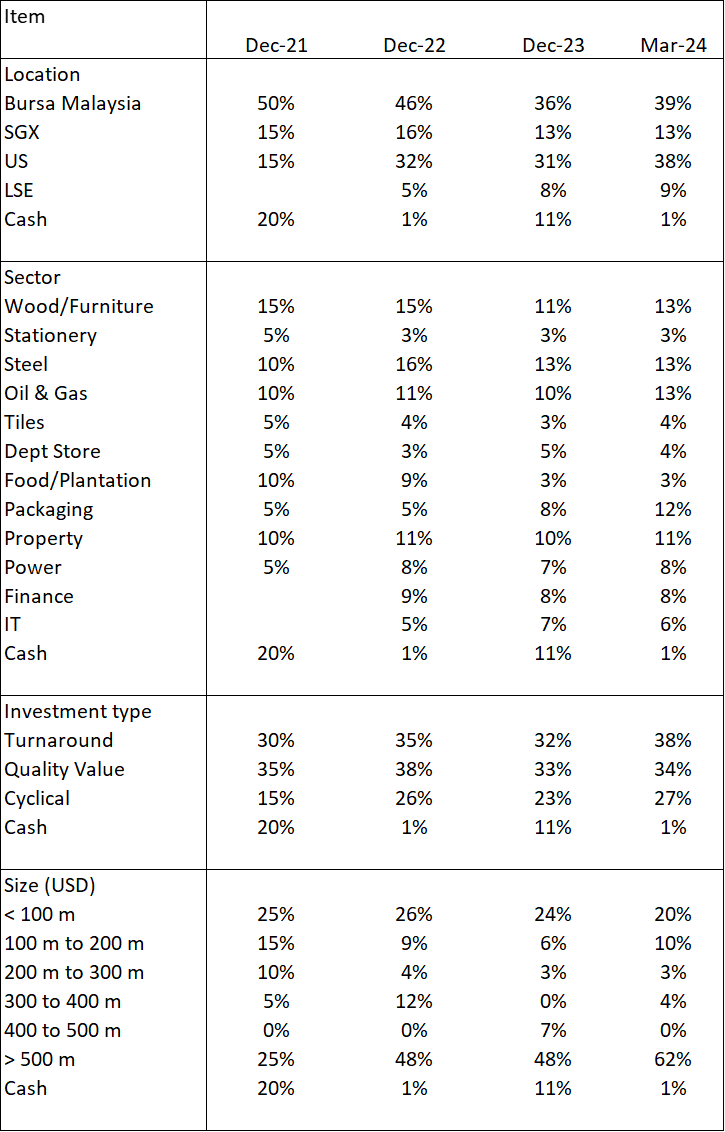
Refer to my earlier post on this series for the details. The diversity profile at the end of March 2024 is presented in Table 7. You can see that cash reduced in this quarter compared to the other quarters.
The other feature from Table 7 is that over the past 2 years, I have reduced the exposure to Bursa Malaysia from 50% when I first started to 39 % currently. At the same time, I have increased the exposure to the US from 15 % at the end of 2021 to 38 % currently.
 |
| Table 7: Diversity Profile |
My stock-picking portfolio template
When you invest in stocks for the long term, you should set up a process to track the activities of individual stocks as well as the stock portfolio. I have an EXCEL workbook that I use to do this. Refer to Standard Portfolio Template.
I hope it can serve as a template for you to develop your process. This is the EXCEL workbook that I used to track the winning stock portfolio. It is broken down into several worksheets so that I can track the following:
- The performance of individual stocks.
- The overall cash position of the fund.
- The stock portfolio performance covering the returns and risk.
The various elements in the workbook are self-explanatory as you can refer to the various formulae.
Secondly, if you want further insights into how I have used the returns and diversity profile, you can refer to the quarterly blog articles on the winning stock portfolio.
But to summarize what has to be done to track individual stocks,
- Keep a record of the stocks you own in your portfolio. This includes the number of shares, purchase price, and current market value for each stock.
- Maintain a record of all buy and sell transactions within your portfolio. This includes transaction dates, quantities, prices, and any associated fees or taxes.
- Keep track of the cost basis (purchase price plus fees) for each holding to calculate capital gains or losses when selling stocks.
- Track dividends received from stocks to monitor dividend yields.
At the portfolio level, you should track the portfolio performance and the risk profile. In the context of performance, you should periodically:
- Calculate the total value of your portfolio by summing up the market values of all the stocks held.
- Track performance metrics such as overall portfolio return, individual stock returns, and benchmark comparisons.
When it comes to risk assessment, the focus is on whether the portfolio is well diversified. As such you should regularly review and rebalance your portfolio to realign stock allocations with your investment objectives. Rebalancing may involve buying or selling stocks to maintain the desired weighting
Conclusion
There are 2 key questions when reviewing and interpreting the results of the portfolio review:
- How did we perform?
- Are we still well diversified?
The key is to look at the returns and diversity and not get bogged down in the computation. As such I used an EXCEL spreadsheet to track the various stock transactions and the portfolio performance. I hope you can adopt the template.
END
- - - - - - - - - - - - - - - - - - - - - - - - - - - - - - - - - -
- - - - - - - - - - - - - - - - - - - - - - - - - - - - - - - - - -
How to be an Authoritative Source, Share This Post
If the above article was useful, you can find more insights on how to make money in my e-book. The e-book is now available from Amazon, Kobo and Google Play.
PS: If you are in Malaysia or Singapore, the e-book can only be download from Kobo and Google Play.
How to be an Authoritative Source, Share This Post
|
Disclaimer & DisclosureI am not an investment adviser, security analyst, or stockbroker. The contents are meant for educational purposes and should not be taken as any recommendation to purchase or dispose of shares in the featured companies. Investments or strategies mentioned on this website may not be suitable for you and you should have your own independent decision regarding them.
The opinions expressed here are based on information I consider reliable but I do not warrant its completeness or accuracy and should not be relied on as such.
I may have equity interests in some of the companies featured.
This blog is reader-supported. When you buy through links in the post, the blog will earn a small commission. The payment comes from the retailer and not from you.
Disclaimer & Disclosure
I am not an investment adviser, security analyst, or stockbroker. The contents are meant for educational purposes and should not be taken as any recommendation to purchase or dispose of shares in the featured companies. Investments or strategies mentioned on this website may not be suitable for you and you should have your own independent decision regarding them.
The opinions expressed here are based on information I consider reliable but I do not warrant its completeness or accuracy and should not be relied on as such.
I may have equity interests in some of the companies featured.
This blog is reader-supported. When you buy through links in the post, the blog will earn a small commission. The payment comes from the retailer and not from you.


Comments
Post a Comment